Enfusion Investor Presentation Deck
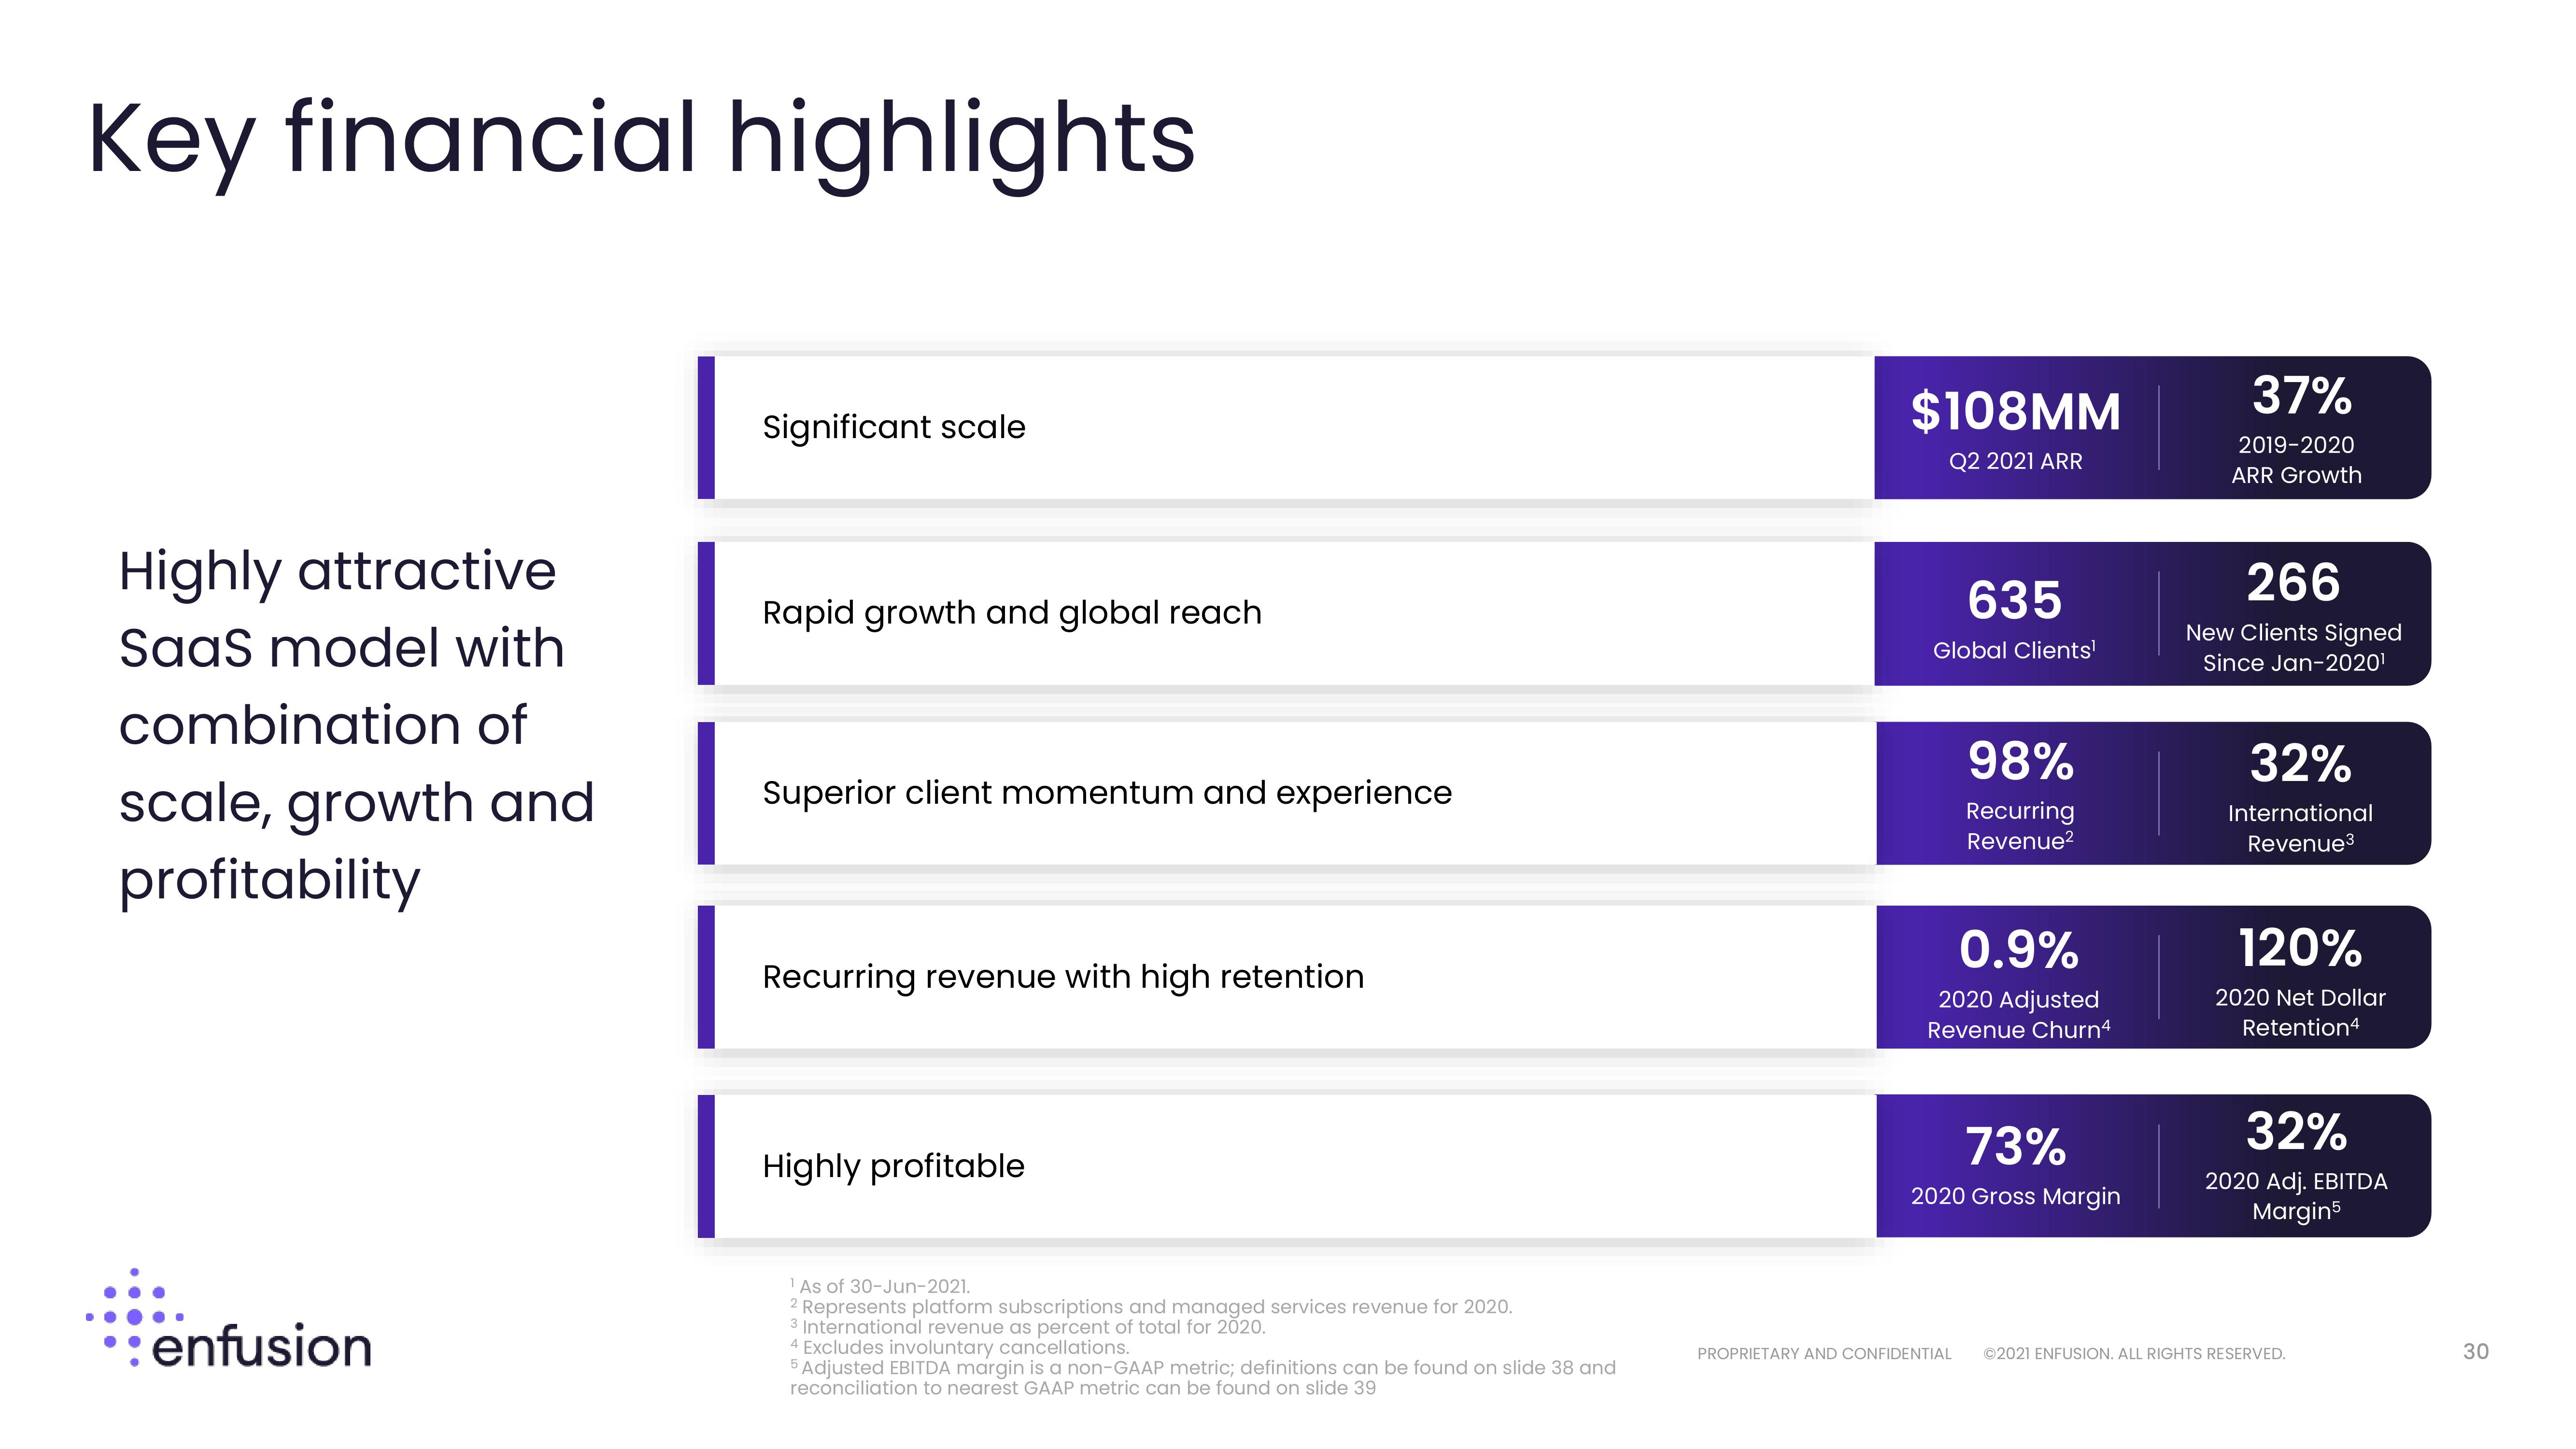
Key financial highlights
Highly attractive
Saas model with
combination of
scale, growth and
profitability
enfusion
Significant scale
Rapid growth and global reach
Superior client momentum and experience
Recurring revenue with high retention
Highly profitable
¹ As of 30-Jun-2021.
2 Represents platform subscriptions and managed services revenue for 2020.
3 International revenue as percent of total for 2020.
4 Excludes involuntary cancellations.
5 Adjusted EBITDA margin is a non-GAAP metric; definitions can be found on slide 38 and
reconciliation to nearest GAAP metric can be found on slide 39
$108MM
Q2 2021 ARR
635
Global Clients¹
98%
Recurring
Revenue²
0.9%
2020 Adjusted
Revenue Churn4
73%
2020 Gross Margin
PROPRIETARY AND CONFIDENTIAL
37%
2019-2020
ARR Growth
266
New Clients Signed
Since Jan-2020¹
32%
International
Revenue³
120%
2020 Net Dollar
Retention4
32%
2020 Adj. EBITDA
Margin5
©2021 ENFUSION. ALL RIGHTS RESERVED.
30View entire presentation