Solar Industry Update
2022 USD per Wdc✶
2.0
1.91
1.8
1.6
Utility-Scale PV Installed Costs
by Country, 2022
1.4
1.22
1.2
1.12
1.05
1.0
0.8
0.6
0.4
0.2
Japan (7)
Netherlands
(10)
United States
(2)
Poland (8)
Top 10 Global PV Markets in 2022
Source: International Renewable Energy Agency. 2023. Renewable Power Generation Costs in 2022
Other Soft Costs
Installation Labor
Balance of System
Inverters
Modules
•
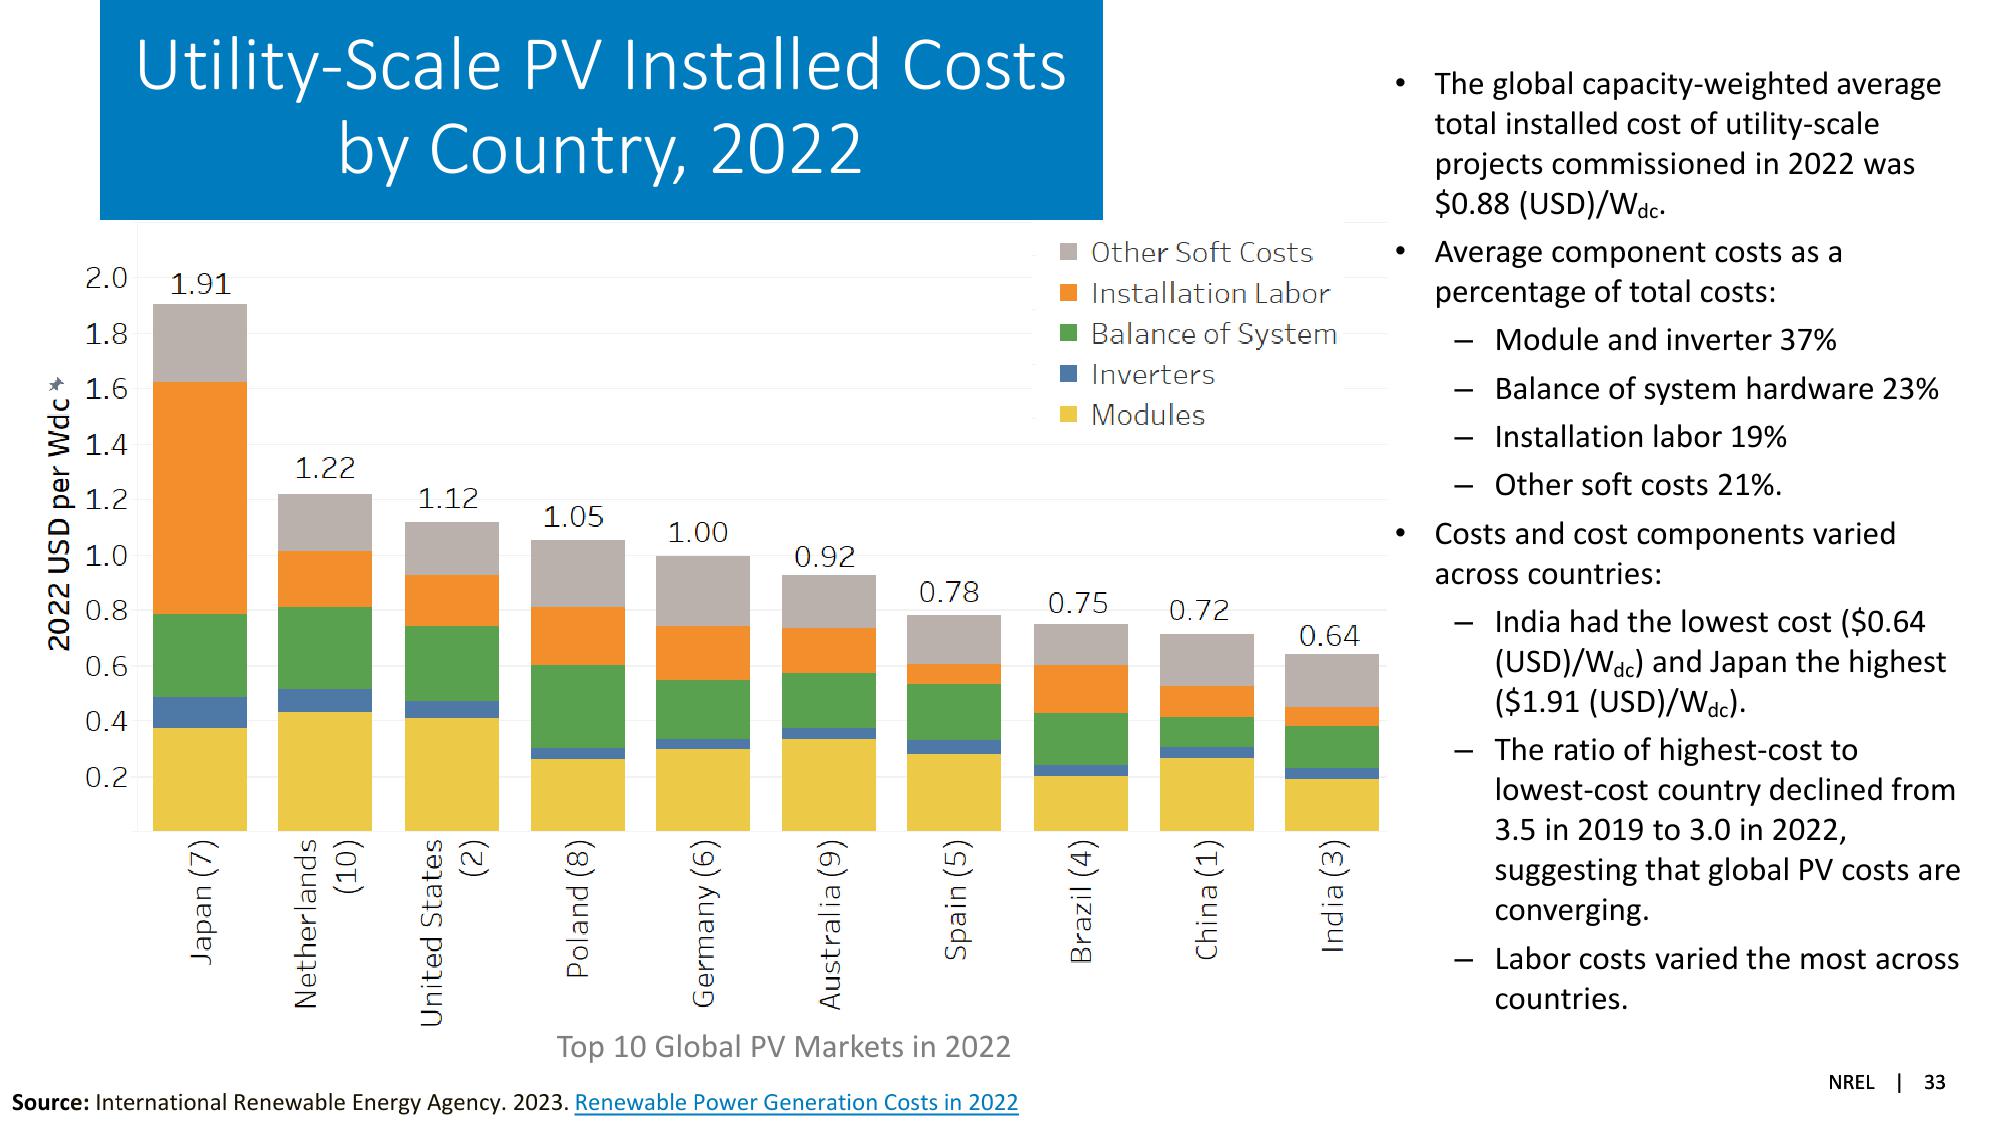
Average component costs as a
The global capacity-weighted average
total installed cost of utility-scale
projects commissioned in 2022 was
$0.88 (USD)/Wdc.
percentage of total costs:
-
Module and inverter 37%
-
Balance of system hardware 23%
―
Installation labor 19%
-
Other soft costs 21%.
1.00
Germany (6)
0.92
Australia (9)
0.78
Spain (5)
0.75
Brazil (4)
0.72
China (1)
0.64
India (3)
Costs and cost components varied
across countries:
India had the lowest cost ($0.64
(USD)/Wdc) and Japan the highest
($1.91 (USD)/Wdc).
The ratio of highest-cost to
lowest-cost country declined from
3.5 in 2019 to 3.0 in 2022,
suggesting that global PV costs are
converging.
Labor costs varied the most across
countries.
NREL 33View entire presentation