Grindr Investor Presentation Deck
3
Market
Positioning
Monthly
Active Users(1)
Daily Time Spent
Per User(2)
# Of Countries (3)
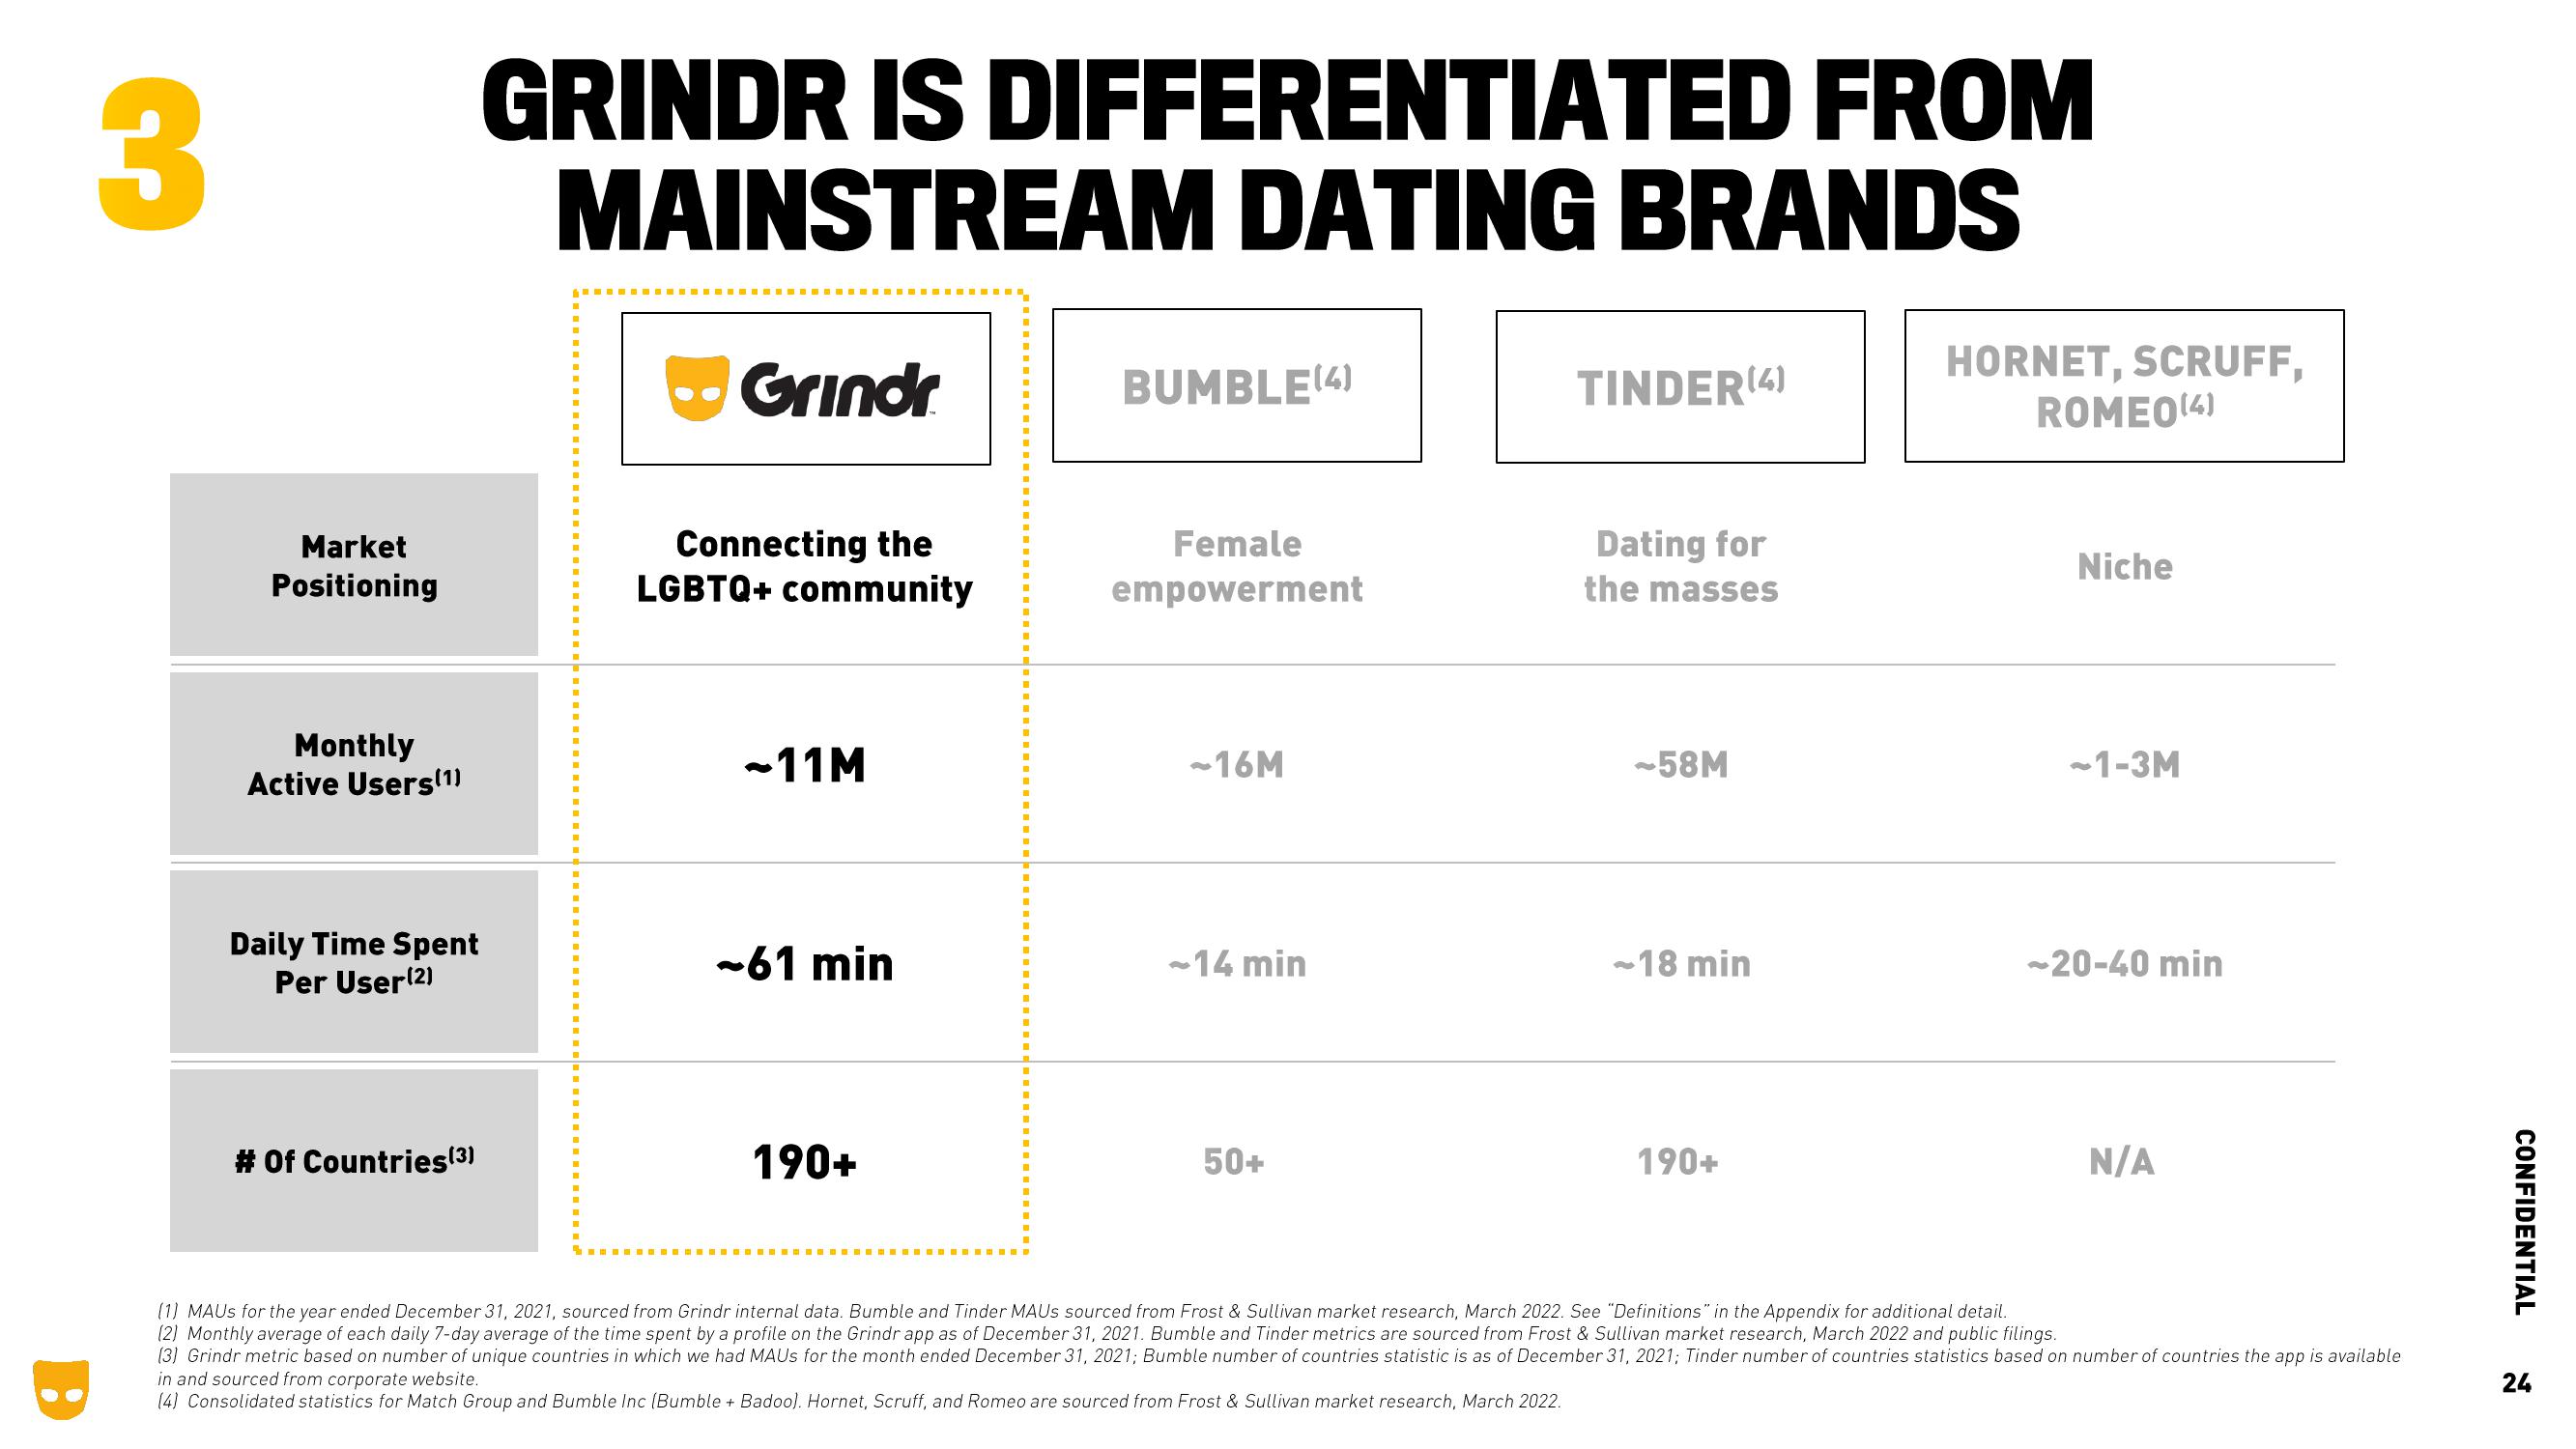
GRINDR IS DIFFERENTIATED FROM
MAINSTREAM DATING BRANDS
‒‒‒‒‒‒‒‒‒‒‒‒‒‒‒‒‒‒‒‒‒‒‒‒
■
Grindr
Connecting the
LGBTQ+ community
-11M
-61 min
190+
‒‒‒‒‒‒‒‒‒
"
B
■
1
1
■
H
■
"
·
U
"
■
■
■
H
■
"
■
■
B
M
■
1
-
D
"
■
‒‒‒‒‒D
BUMBLE(4)
Female
empowerment
-16M
~14 min
50+
TINDER (4)
Dating for
the masses
-58M
-18 min
190+
HORNET, SCRUFF,
ROMEO (4)
Niche
-1-3M
-20-40 min
N/A
(1) MAUs for the year ended December 31, 2021, sourced from Grindr internal data. Bumble and Tinder MAUS sourced from Frost & Sullivan market research, March 2022. See "Definitions" in the Appendix for additional detail.
(2) Monthly average of each daily 7-day average of the time spent by a profile on the Grindr app as of December 31, 2021. Bumble and Tinder metrics are sourced from Frost & Sullivan market research, March 2022 and public filings.
(3) Grindr metric based on number of unique countries in which we had MAUS for the month ended December 31, 2021; Bumble number of countries statistic is as of December 31, 2021; Tinder number of countries statistics based on number of countries the app is available
in and sourced from corporate website.
(4) Consolidated statistics for Match Group and Bumble Inc (Bumble + Badoo). Hornet, Scruff, and Romeo are sourced from Frost & Sullivan market research, March 2022.
CONFIDENTIAL
24View entire presentation