Origin SPAC Presentation Deck
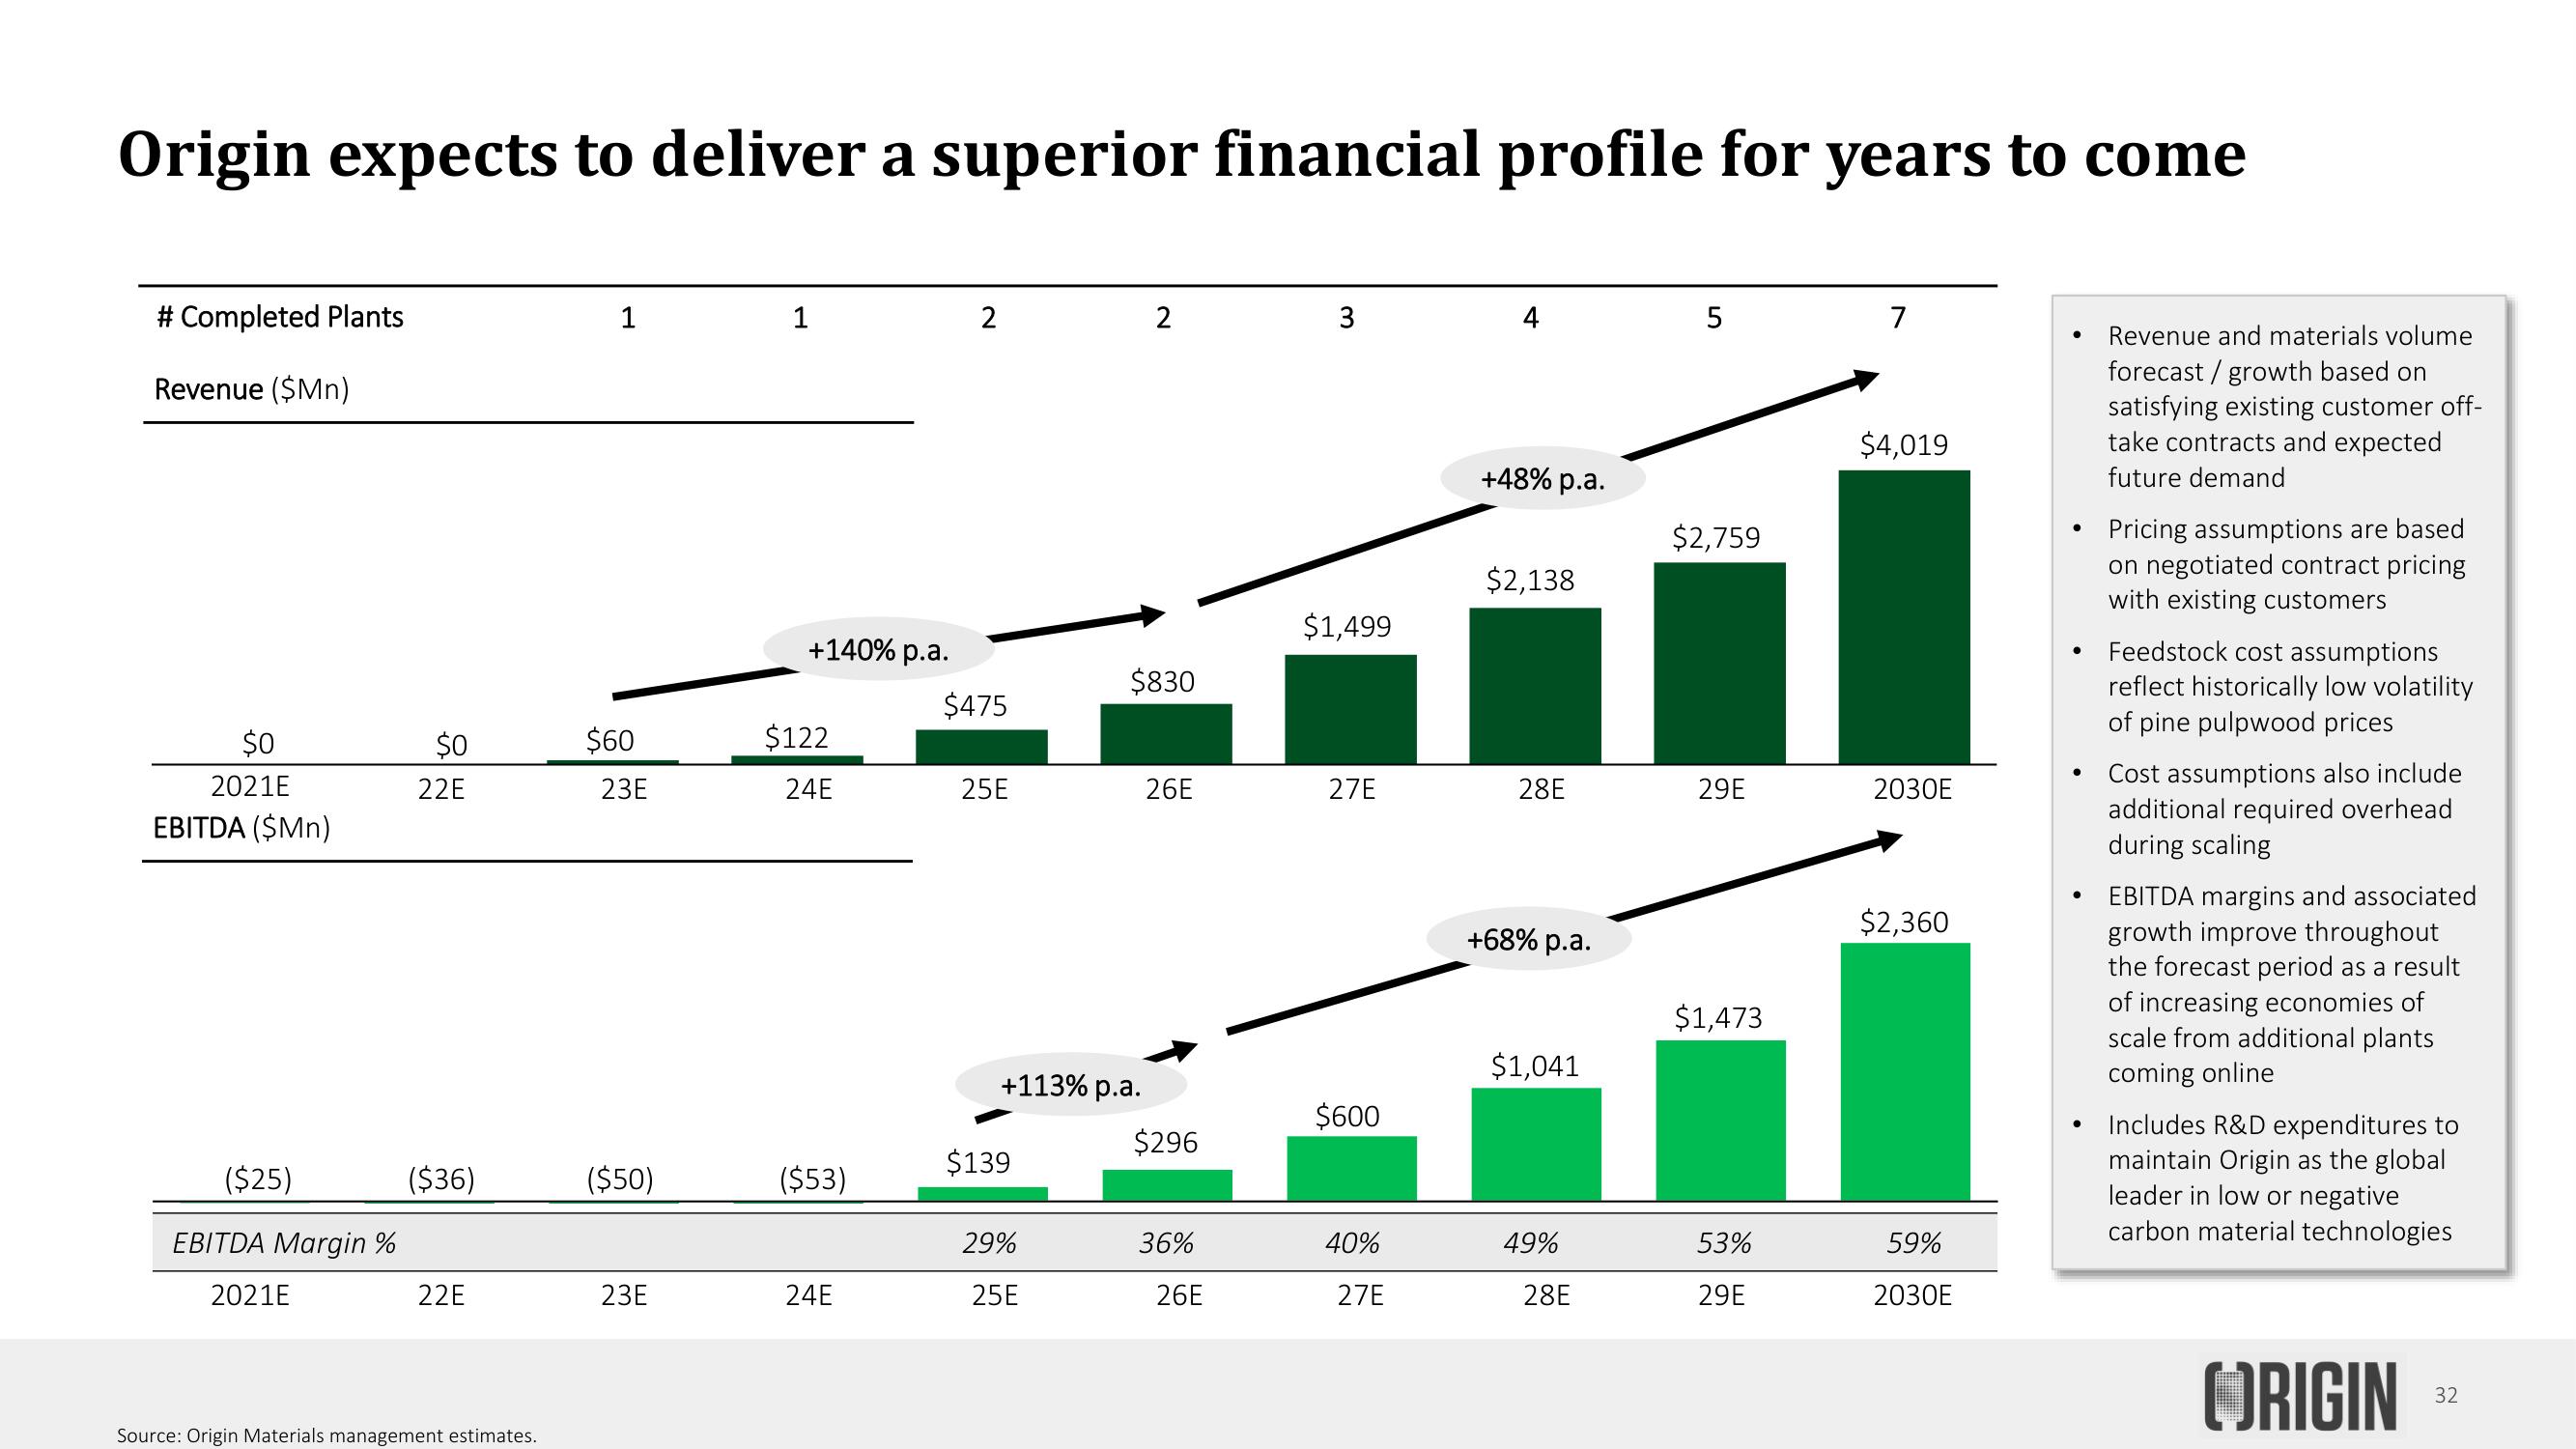
Origin expects to deliver a superior financial profile for years to come
# Completed Plants
Revenue ($Mn)
$0
2021E
EBITDA ($Mn)
EB
($25)
Margin %
2021E
$0
22E
($36)
22E
Source: Origin Materials management estimates.
1
$60
23E
($50)
23E
1
+140% p.a.
$122
24E
($53)
24E
2
$475
25E
+113% p.a.
$139
29%
25E
2
$830
26E
$296
36%
26E
3
$1,499
27E
$600
0%
27E
+48% p.a.
$2,138
28E
+68% p.a.
$1,041
49%
28E
5
$2,759
29E
$1,473
53%
29E
7
$4,019
2030E
$2,360
59%
2030E
●
●
●
●
Revenue and materials volume
forecast / growth based on
satisfying existing customer off-
take contracts and expected
future demand
Pricing assumptions are based
on negotiated contract pricing
with existing customers
Feedstock cost assumptions
reflect historically low volatility
of pine pulpwood prices
Cost assumptions also include
additional required overhead
during scaling
EBITDA margins and associated
growth improve throughout
the forecast period as a result
of increasing economies of
scale from additional plants
coming online
Includes R&D expenditures to
maintain Origin as the global
leader in low or negative
carbon material technologies
ORIGIN
32View entire presentation