MSR Value Growth & Market Trends
14 |
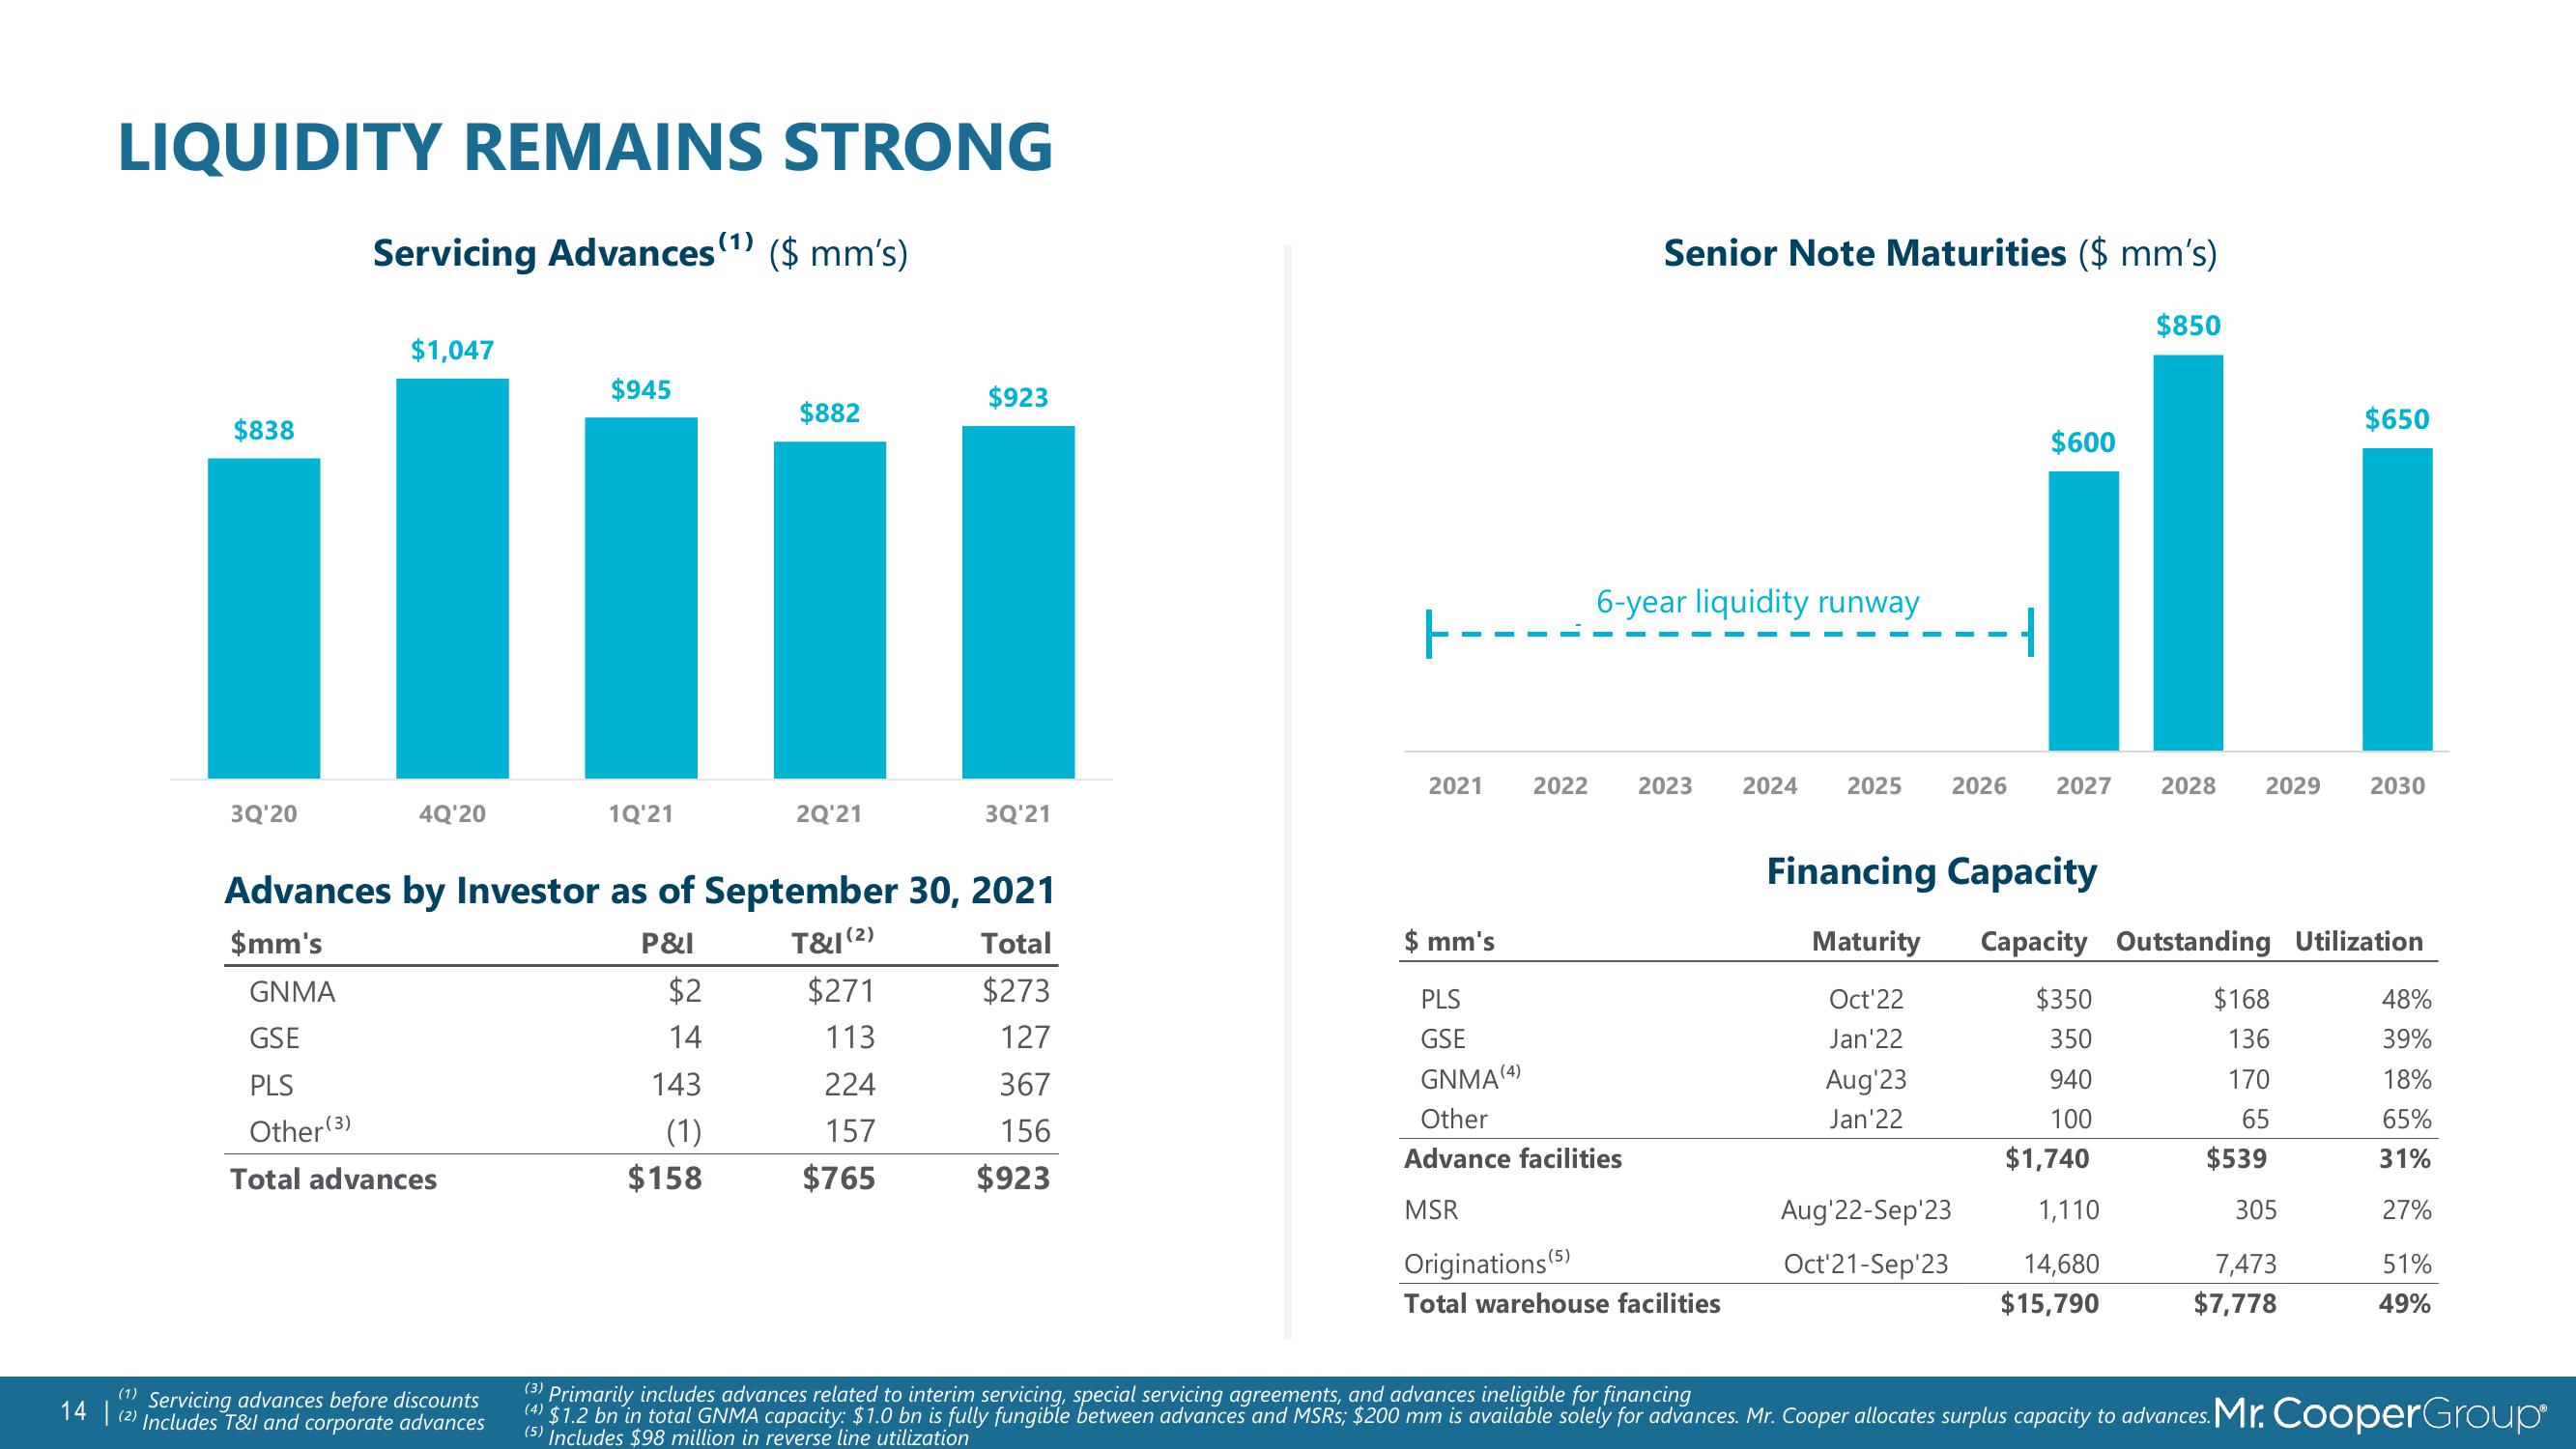
LIQUIDITY REMAINS STRONG
Servicing Advances (1) ($ mm's)
$838
3Q'20
$1,047
4Q'20
GNMA
GSE
PLS
Other (3)
Total advances
(1) Servicing advances before discounts
$945
(2) Includes T&I and corporate advances
1Q'21
Advances by Investor as of September 30, 2021
$mm's
P&I
T&I (2)
Total
$273
127
367
156
$923
$2
14
$882
143
(1)
$158
2Q¹21
$271
113
$923
224
157
$765
3Q'21
Senior Note Maturities ($ mm's)
6-year liquidity runway
2021 2022 2023 2024 2025
$ mm's
PLS
GSE
GNMA (4)
Other
Advance facilities
MSR
Originations (5)
Total warehouse facilities
$850
$650
$600
ili
Aug 22-Sep¹23
Oct¹21-Sep'23
2026 2027
Financing Capacity
Maturity
Oct¹22
Jan 22
Aug 23
Jan'22
Capacity Outstanding Utilization
$350
350
940
100
$1,740
2028 2029 2030
1,110
14,680
$15,790
$168
136
170
65
$539
305
7,473
$7,778
48%
39%
18%
65%
31%
27%
51%
49%
(3) Primarily includes advances related to interim servicing, special servicing agreements, and advances ineligible for financing
(4) $1.2 bn in total GNMA capacity: $1.0 bn is fully fungible between advances and MSRs; $200 mm is available solely for advances. Mr. Cooper allocates surplus capacity to advances. Mr. CooperGroup
(5) Includes $98 million in reverse line utilizationView entire presentation