Tesla Results Presentation Deck
21
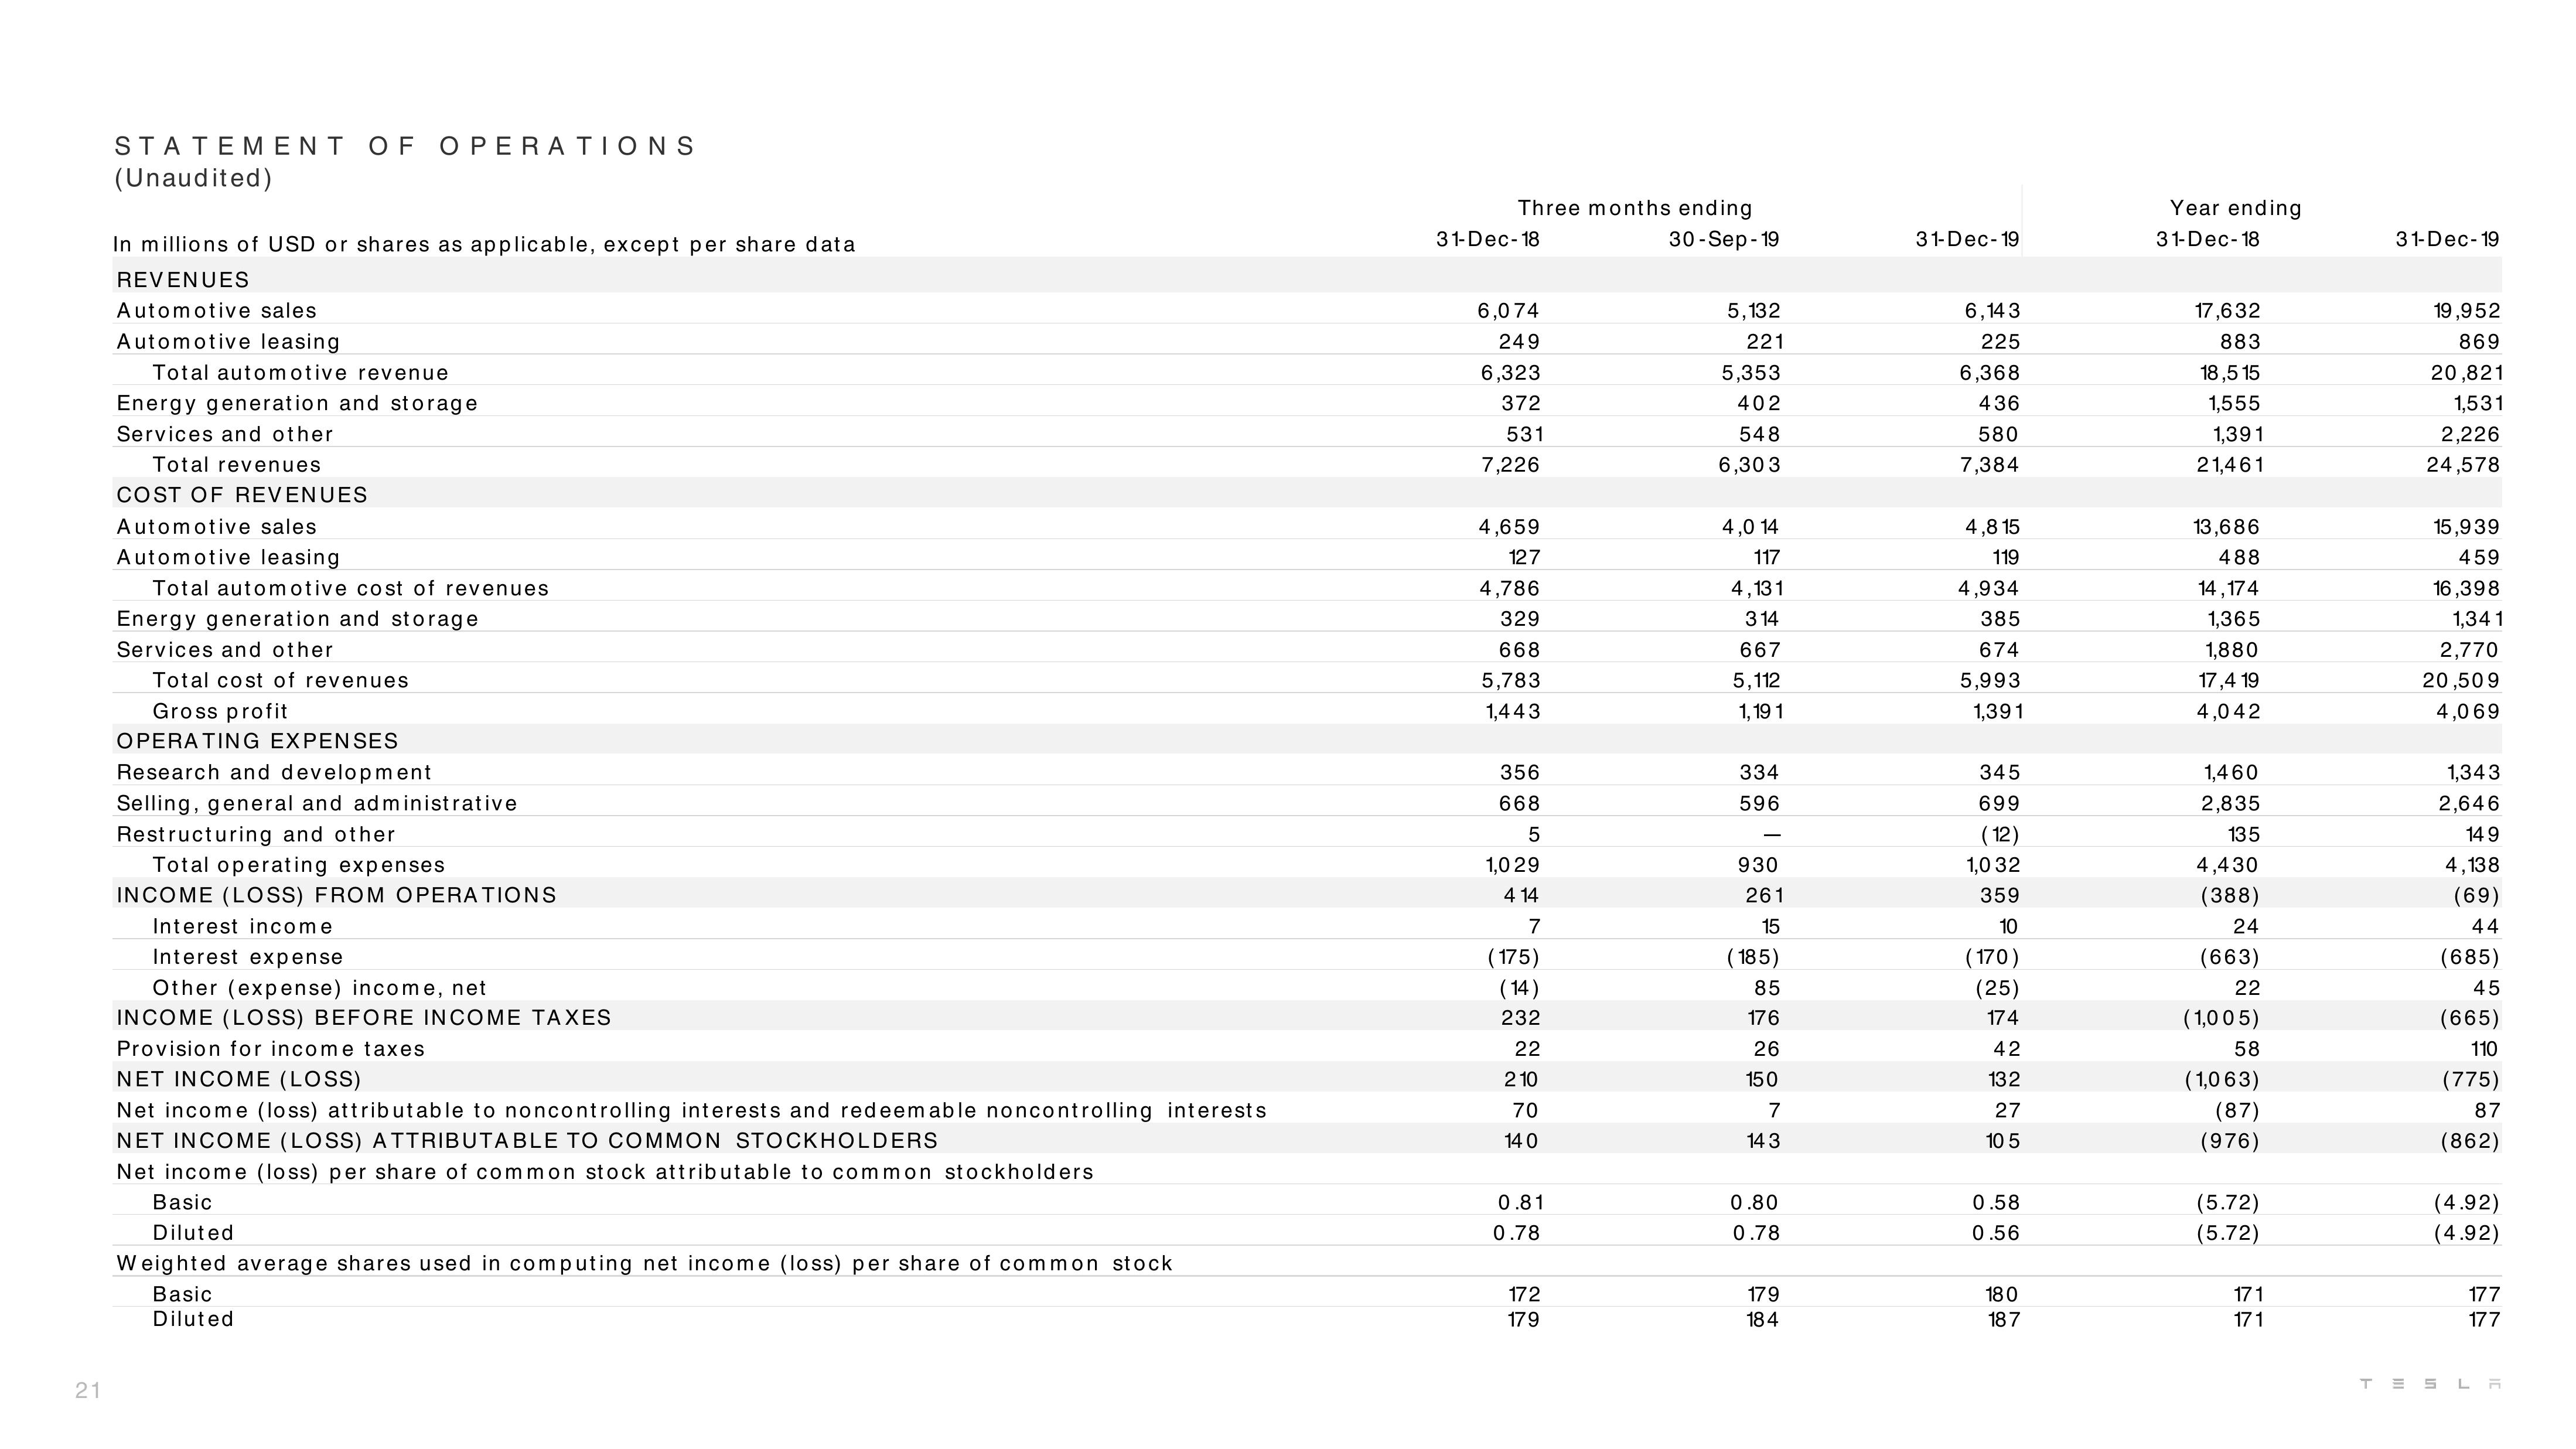
STATEMENT OF OPERATIONS
(Unaudited)
In millions of USD or shares as applicable, except per share data
REVENUES
Automotive sales.
Automotive leasing
Total automotive revenue
Energy generation and storage
Services and other
Total revenues
COST OF REVENUES
Automotive sales
Automotive leasing
Total automotive cost of revenues
Energy generation and storage
Services and other
Total cost of revenues
Gross profit
OPERATING EXPENSES
Research and development
Selling, general and administrative
Restructuring and other
Total operating expenses
INCOME (LOSS) FROM OPERATIONS
Interest income
Interest expense
Other (expense) income, net
INCOME (LOSS) BEFORE INCOME TAXES
Provision for income taxes
NET INCOME (LOSS)
Net income (loss) attributable to noncontrolling interests and redeemable noncontrolling interests
NET INCOME (LOSS) ATTRIBUTABLE TO COMMON STOCKHOLDERS
Net income (loss) per share of common stock attributable to common stockholders
Basic
Diluted
Weighted average shares used in computing net income (loss) per share of common stock.
Basic
Diluted
Three months ending
31-Dec-18
6,074
249
6,323
372
531
7,226
4,659
127
4,786
329
668
5,783
1,443
356
668
5
1,029
4 14
7
(175)
(14)
232
22
210
70
14 0
0.81
0.78
172
179
30-Sep-19
5,132
221
5,353
402
548
6,303
4,0 14
117
4,131
314
667
5,112
1,19 1
334
596
930
261
15
(185)
85
176
26
150
7
143
0.80
0.78
179
184
31-Dec-19
6,143
225
6,368
436
580
7,384
4,8 15
119
4,934
385
674
5,993
1,391
345
699
(12)
1,0 32
359
10
(170)
(25)
174
42
132
27
10 5
0.58
0.56
180
187
Year ending
31-Dec-18
17,632
883
18,5 15
1,555
1,391
21,461
13,686
488
14,174
1,365
1,880
17,4 19
4,042
1,460
2,835
135
4,430
(388)
24
(663)
22
(1,005)
58
(1,063)
(87)
(976)
(5.72)
(5.72)
171
171
31-Dec-19
19,952
869
20,821
1,531
2,226
24,578
15,939
459
16,398
1,341
2,770
20,509
4,069
1,343
2,646
149
4,138
(69)
44
(685)
45
(665)
110
(775)
87
(862)
(4.92)
(4.92)
177
177
TESLAView entire presentation