Ford Results Presentation Deck
Ford
Model e
Designing and scaling
breakthrough, connected EVs, and
all of Ford's electric architecture
and embedded software
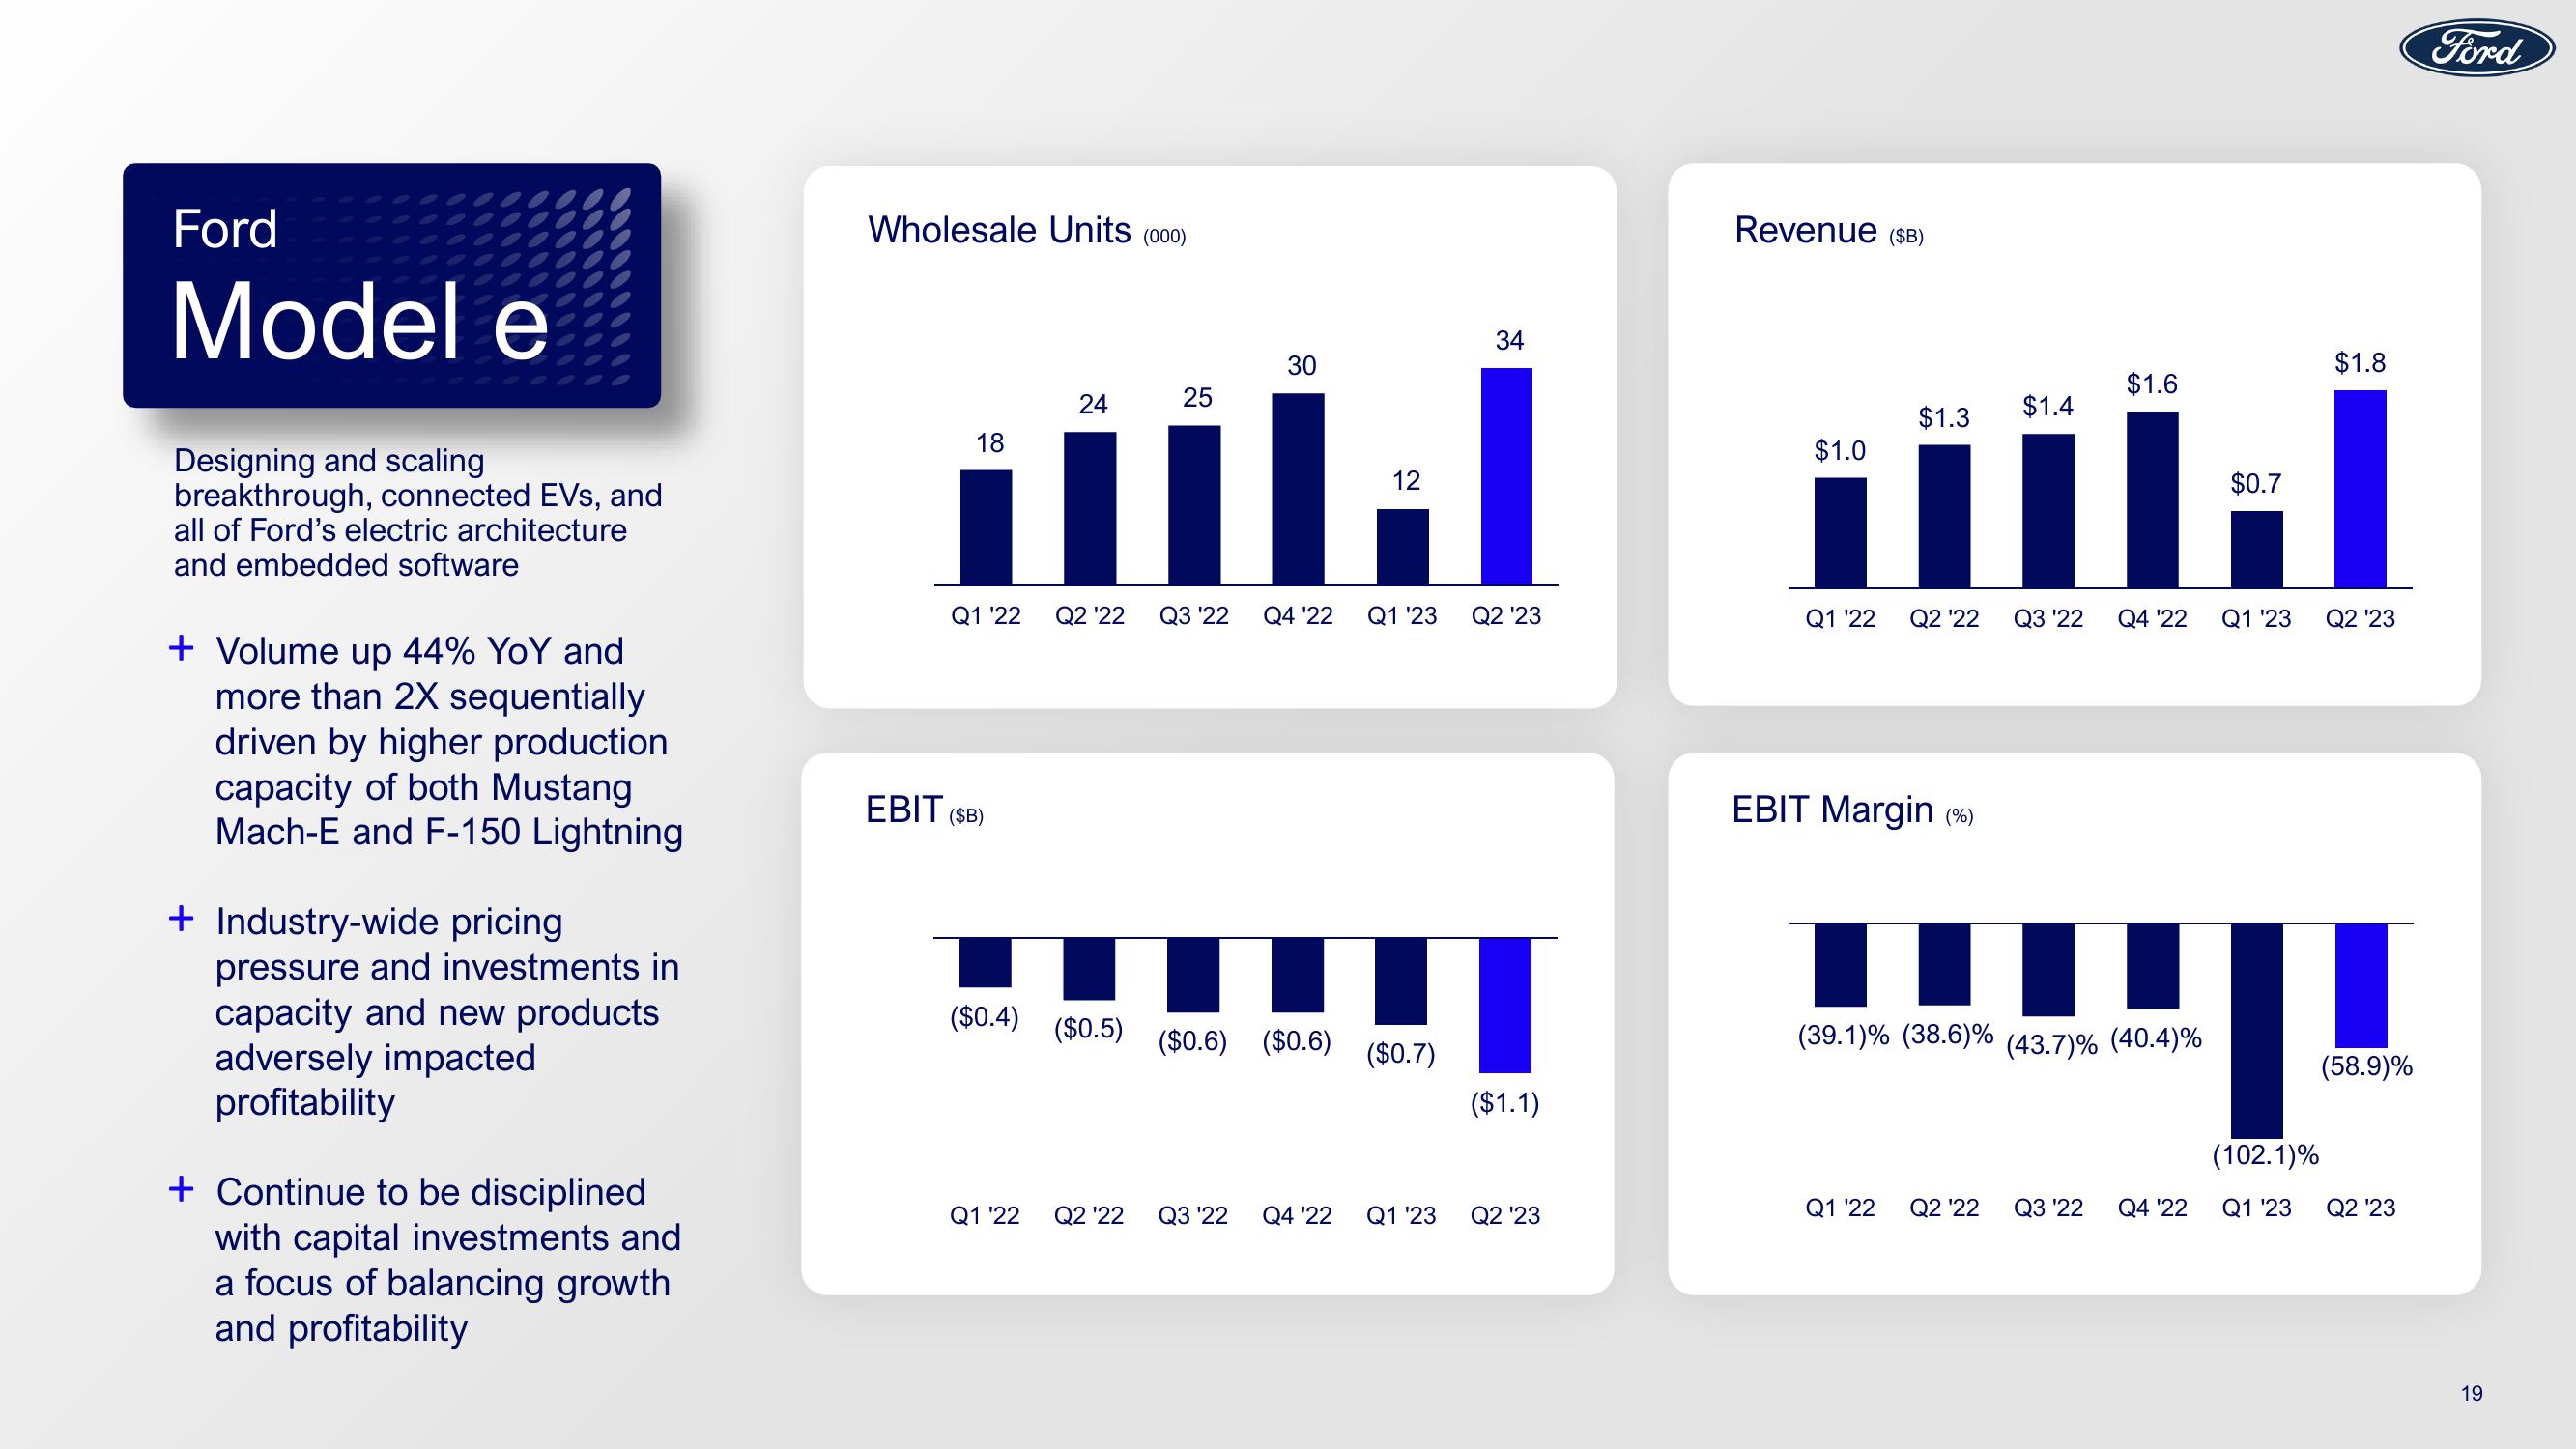
+ Volume up 44% YoY and
more than 2X sequentially
driven by higher production
capacity of both Mustang
Mach-E and F-150 Lightning
+ Industry-wide pricing
pressure and investments in
capacity and new products
adversely impacted
profitability
+ Continue to be disciplined
with capital investments and
a focus of balancing growth
and profitability
Wholesale Units
18
24
EBIT ($B)
(000)
($0.4) ($0.5)
25
Q1 '22 Q2 '22 Q3 '22 Q4 '22
30
($0.6) ($0.6)
12
Q1 '23
($0.7)
Q1 '22 Q2 '22 Q3 '22 Q4 '22 Q1 '23
34
Q2 '23
($1.1)
Q2 '23
Revenue ($B)
$1.0
$1.3
Q1 '22 Q2 '22
EBIT Margin (%)
$1.4
Q1 '22 Q2 '22
Q3 '22
$1.6
(39.1) % (38.6)% (43.7)% (40.4)%
Q3 '22
Q4 '22
Q4 '22
$0.7
Q1 '23
(102.1)%
Q1 '23
$1.8
Q2 '23
|
(58.9)%
Q2 '23
Ford
19View entire presentation