Granite Ridge Investor Presentation Deck slide image

Granite Ridge Investor Presentation Deck

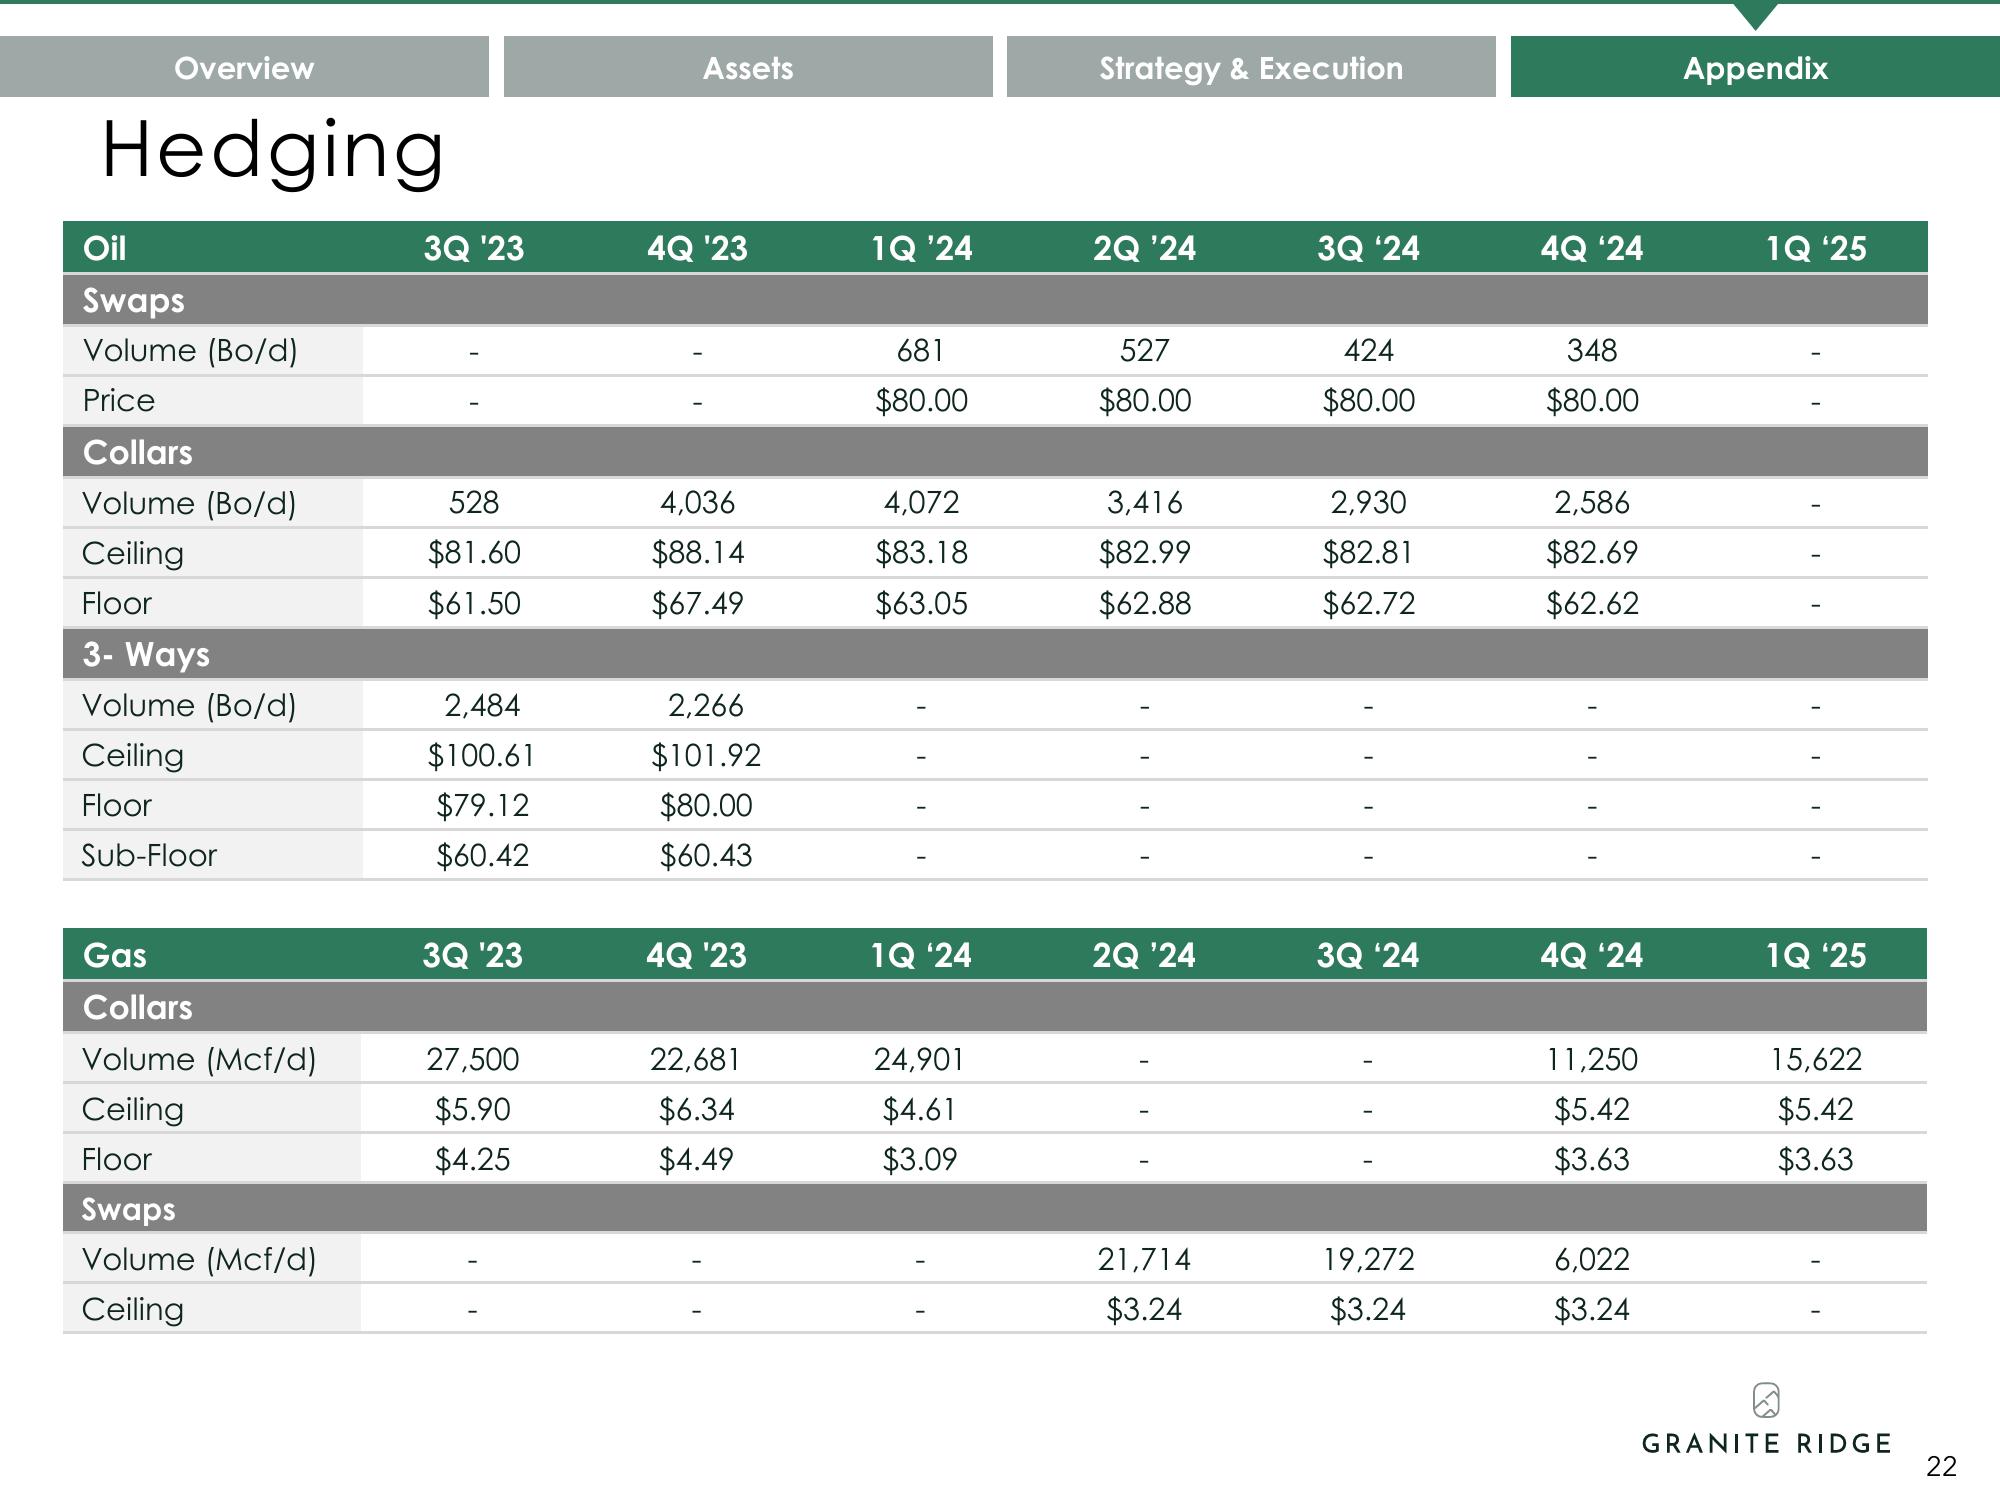
Overview Hedging Oil Swaps Volume (Bo/d) Price Collars Volume (Bo/d) Ceiling Floor 3- Ways Volume (Bo/d) Ceiling Floor Sub-Floor Gas Collars Volume (Mcf/d) Ceiling Floor Swaps Volume (Mcf/d) Ceiling 3Q '23 528 $81.60 $61.50 2,484 $100.61 $79.12 $60.42 3Q '23 27,500 $5.90 $4.25 Assets 4Q '23 4,036 $88.14 $67.49 2,266 $101.92 $80.00 $60.43 4Q '23 22,681 $6.34 $4.49 1Q '24 681 $80.00 4,072 $83.18 $63.05 1Q '24 24,901 $4.61 $3.09 Strategy & Execution 2Q '24 527 $80.00 3,416 $82.99 $62.88 2Q '24 21,714 $3.24 3Q '24 424 $80.00 2,930 $82.81 $62.72 3Q '24 19,272 $3.24 4Q '24 348 $80.00 2,586 $82.69 $62.62 4Q '24 11,250 $5.42 $3.63 6,022 $3.24 Appendix 1Q '25 1Q '25 15,622 $5.42 $3.63 @ GRANITE RIDGE 22
View entire presentation