Evercore Investment Banking Pitch Book
Valuation Analyses
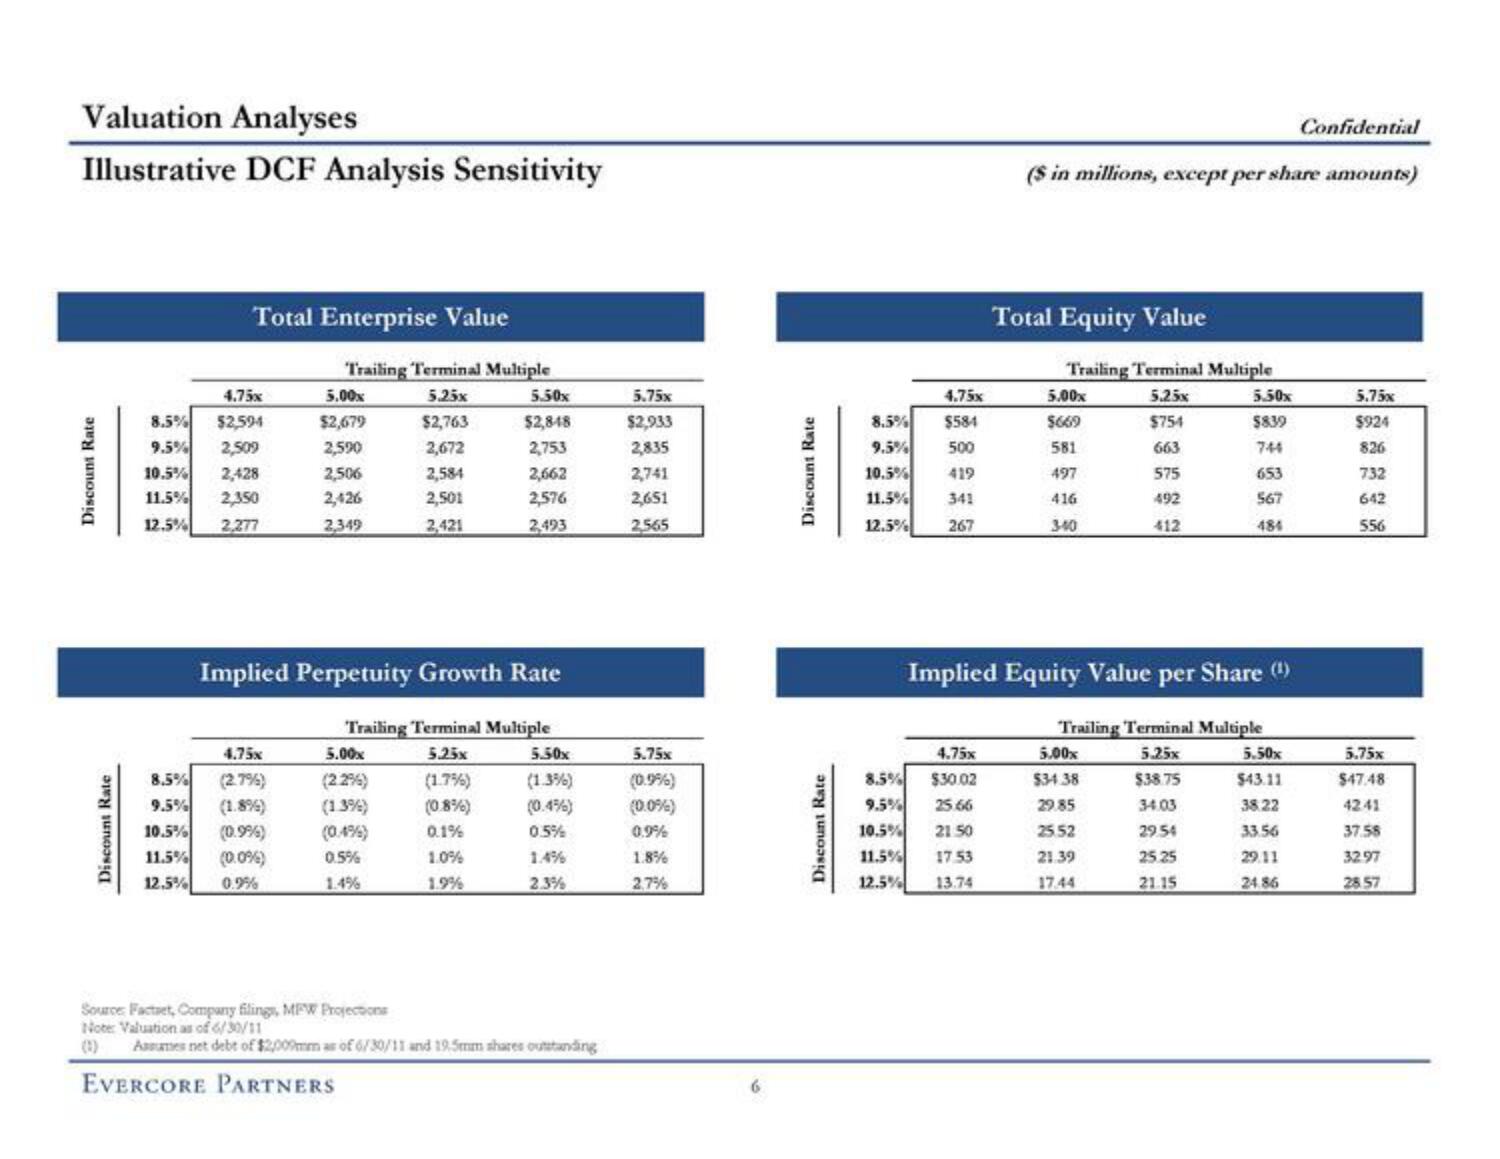
Illustrative DCF Analysis Sensitivity
Discount Rate
Discount Rate
Total Enterprise Value
4.75x
8.5% $2,594
9.5% 2,509
10.5% 2,428
11.5% 2,350
12.5% 2,277
4.75x
8.5% (2.7%)
9.5% (1.8%)
10.5% (0.9%)
11.5% (0.0%)
12.5% 0.9%
Trailing Terminal Multiple
5.25x
$2,763
2,672
2,584
2,501
2,421
5.00x
$2,679
2,590
2,506
2,426
2,349
Implied Perpetuity Growth Rate
5.00x
(22%)
(1.3%)
(0.4%)
0.5%
Trailing Terminal Multiple
5.25x
Source: Factaet, Company filings, MFW Projections
Note: Valuation as of 6/30/11
EVERCORE PARTNERS
5.50x
$2,848
2,753
2,662
2,576
2,493
(1.7%)
(0.8%)
0.1%
1.0%
1.9%
5.50x
(1.3%)
(0.4%)
0.5%
2.3%
Assumes net debt of $2009mm as of 6/30/11 and 19.5mm shares outstanding
5.75x
$2,933
2,835
2,741
2,651
2,565
5.75x
(0.9%)
(0.0%)
0.9%
1.8%
2.7%
Discount Rate
Discount Rate
8.5%
9.5%
10.5%
11.5%
12.5%
4.75x
$584
500
419
341
267
4.75x
8.5% $30.02
9.5% 25.66
10.5% 21.50
11.5%
17.53
12.5%
13.74
($ in millions, except per share amounts)
Total Equity Value
Trailing Terminal Multiple
5.25x
$754
663
575
492
412
5.00x
$669
581
497
416
340
Implied Equity Value per Share (¹)
5.50x
$839
744
5.00%
$34.38
29.85
25.52
21.39
17.44
653
567
484
Trailing Terminal Multiple
5.25x
$38.75
34.03
29.54
25.25
21.15
Confidential
5.50x
$43.11
38.22
33.56
29.11
24.86
5.75x
$924
826
732
642
556
5.75x
$47.48
4241
37.58
32.97
28.57View entire presentation