Bank of America Results Presentation Deck
Balance Sheet, Liquidity and Capital
(EOP¹ basis unless noted)
Balance Sheet Metrics
Assets ($B)
Total assets
Total loans and leases
Total loans and leases in business segments²
Total debt securities
Funding & Liquidity ($B)
Total deposits
Long-term debt
Global Liquidity Sources (average)³
Equity ($B)
Common shareholders' equity
Common equity ratio
Tangible common shareholders' equity4
Tangible common equity ratio
3Q22
$3,073
1,032
1,022
880
¹EOP stands for end of period.
2 Excludes loans and leases in All Other.
$1,938
269
941
$240
7.8 %
$170
5.7 %
Per Share Data
Book value per common share
$29.96
Tangible book value per common share*
21.21
Common shares outstanding (in billions) 8.02
2Q22
$3,112
1,031
1,020
933
$1,984
276
984
$240
7.7 %
$170
5.6 %
$29.87
21.13
8.04
3Q21
$3,085
928
911
969
$1,965
279
1,120
$249
8.1 %
$179
5.9 %
$30.22
21.69
8.24
Basel 3 Capital ($B)5
Common equity tier 1 capital
Standardized approach
Risk-weighted assets (RWA)
CET1 ratio
Advanced approaches
Risk-weighted assets
CET1 ratio
Supplementary leverage
Supplementary Leverage Ratio
●
3Q22
$176
$1,599
11.0 %
$1,391
12.6 %
5.8 %
2Q22
$172
$1,638
10.5 %
$1,407
12.2 %
5.5 %
3Q21
$174
$1,568
11.1 %
$1,380
12.6 %
5.6 %
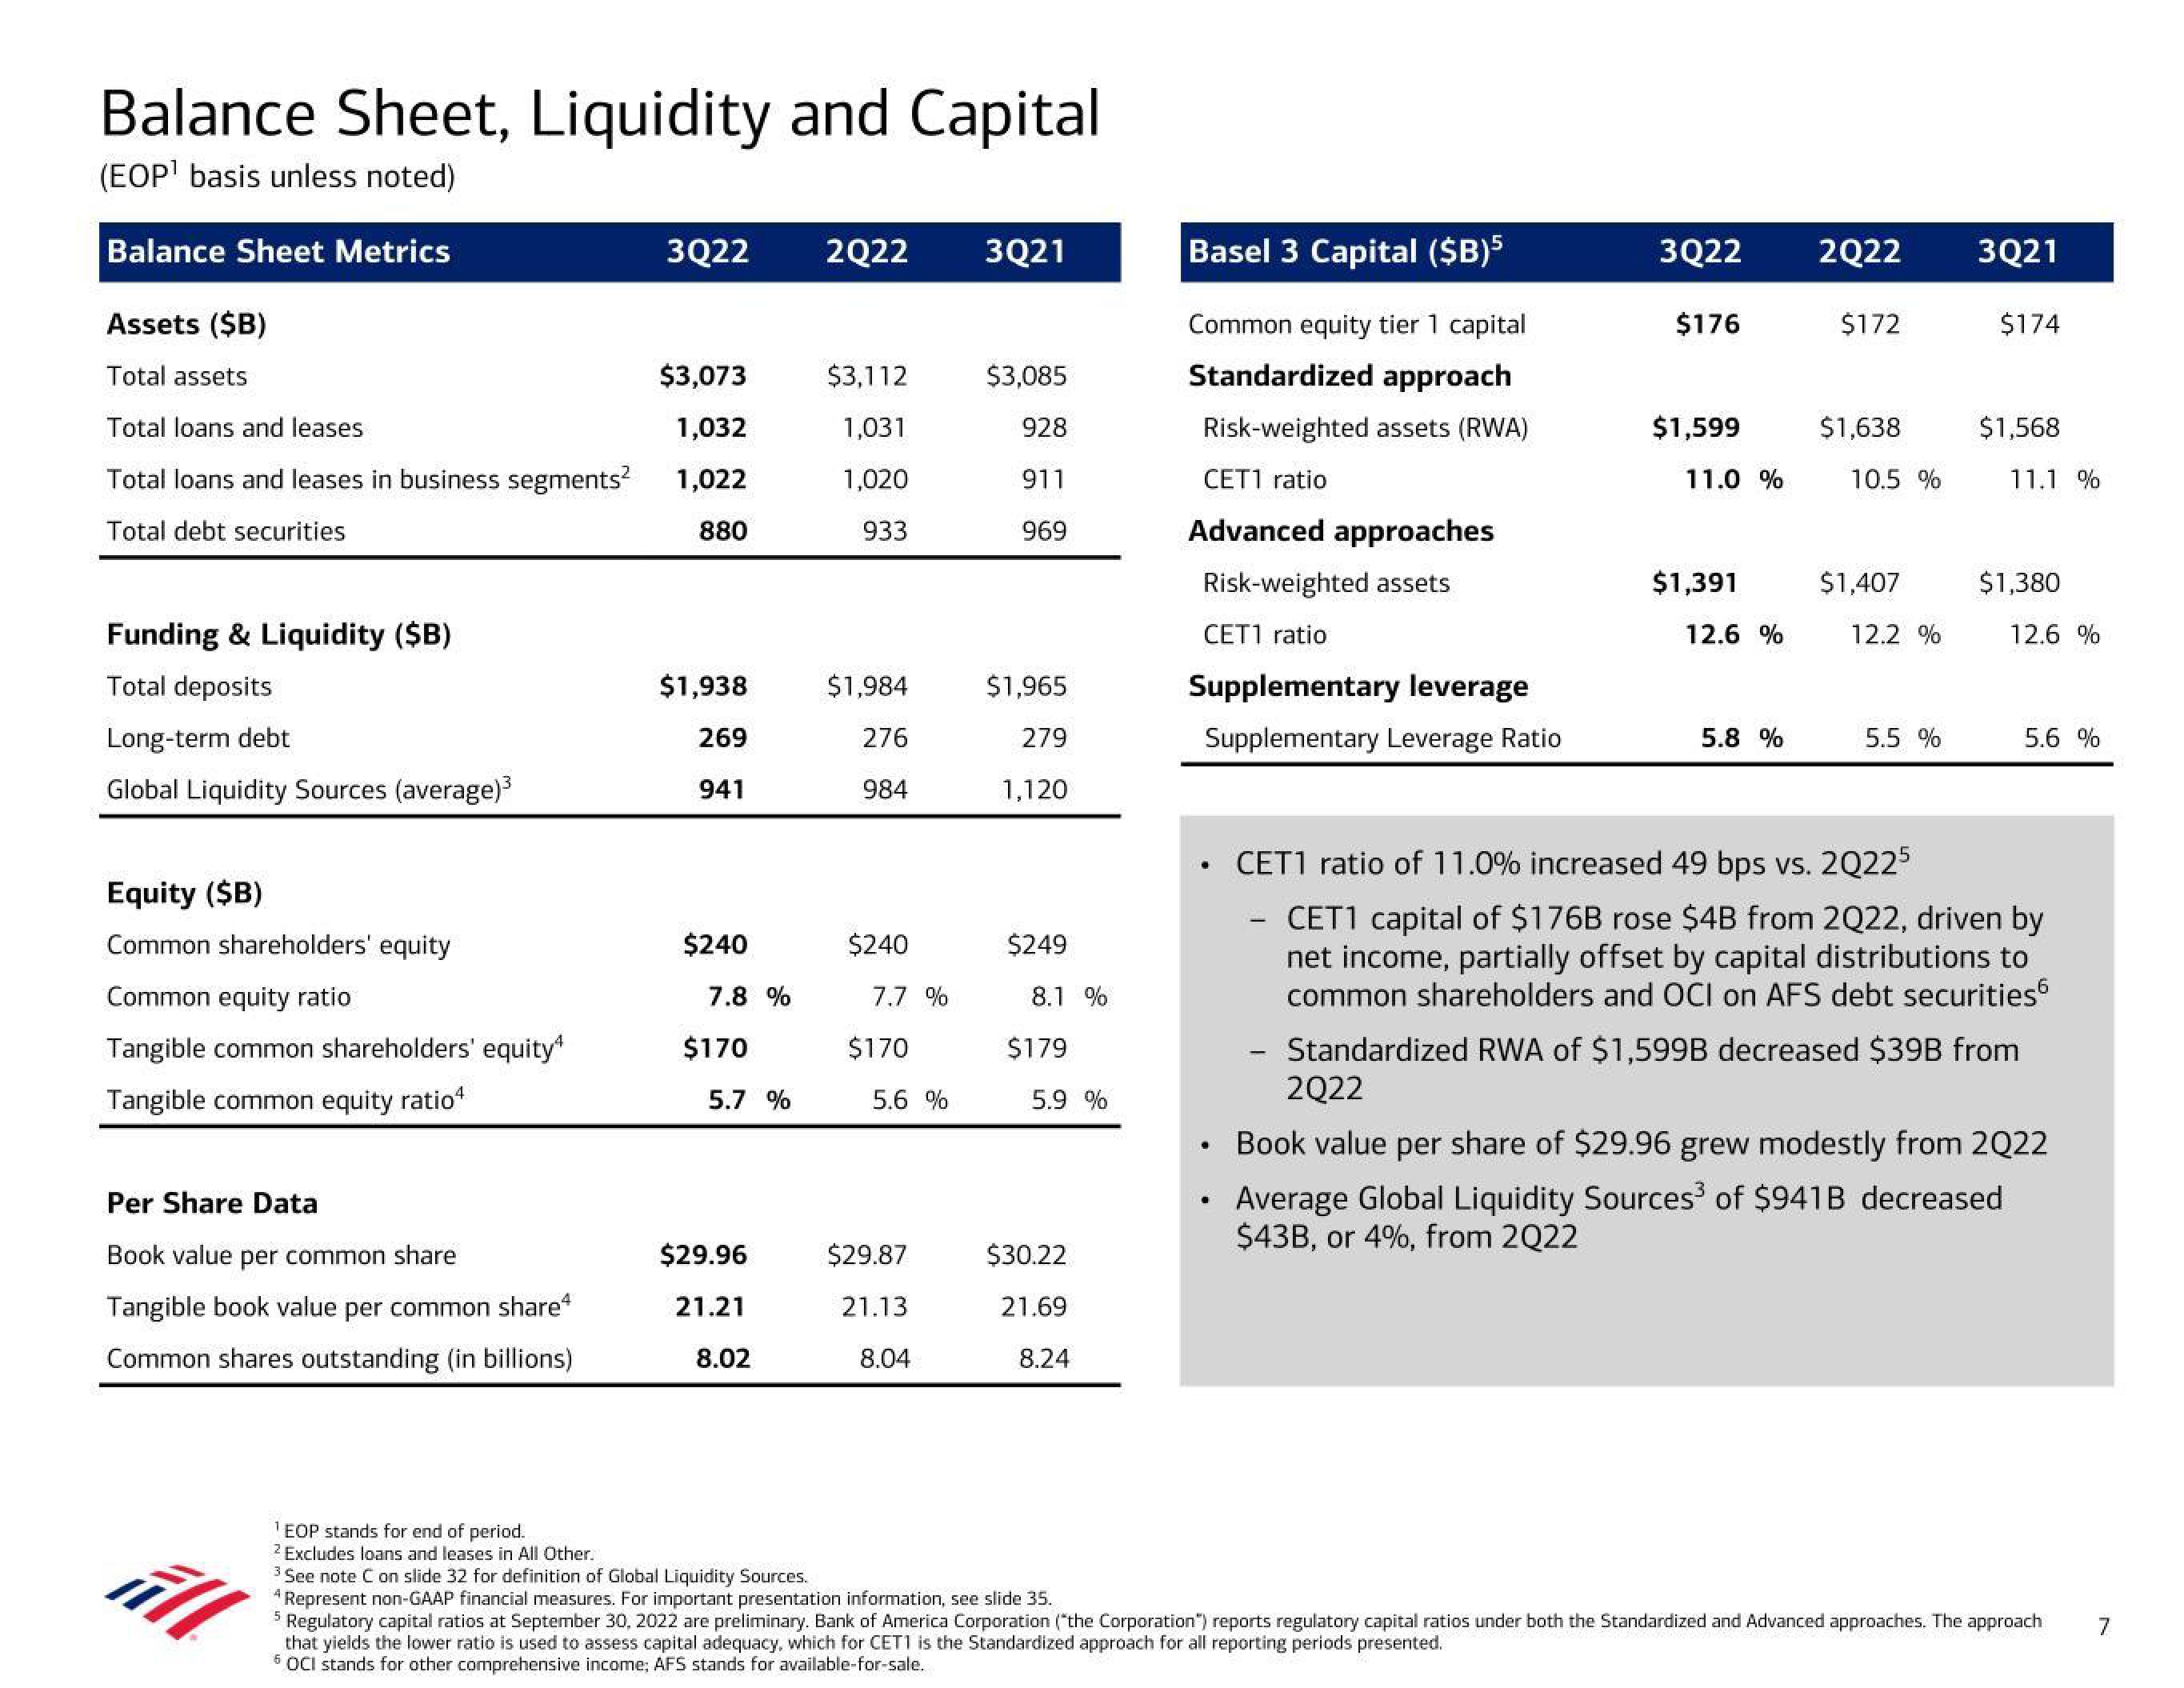
CET1 ratio of 11.0% increased 49 bps vs. 2Q225
CET1 capital of $176B rose $4B from 2022, driven by
net income, partially offset by capital distributions to
common shareholders and OCI on AFS debt securities
Standardized RWA of $1,599B decreased $39B from
2Q22
Book value per share of $29.96 grew modestly from 2022
Average Global Liquidity Sources³ of $941B decreased
$43B, or 4%, from 2Q22
3 See note C on slide 32 for definition of Global Liquidity Sources.
All
4 Represent non-GAAP financial measures. For important presentation information, see slide 35.
5 Regulatory capital ratios at September 30, 2022 are preliminary. Bank of America Corporation ("the Corporation") reports regulatory capital ratios under both the Standardized and Advanced approaches. The approach
that yields the lower ratio is used to assess capital adequacy, which for CET1 is the Standardized approach for all reporting periods presented.
6 OCI stands for other comprehensive income; AFS stands for available-for-sale.
7View entire presentation