MoneyLion SPAC Presentation Deck
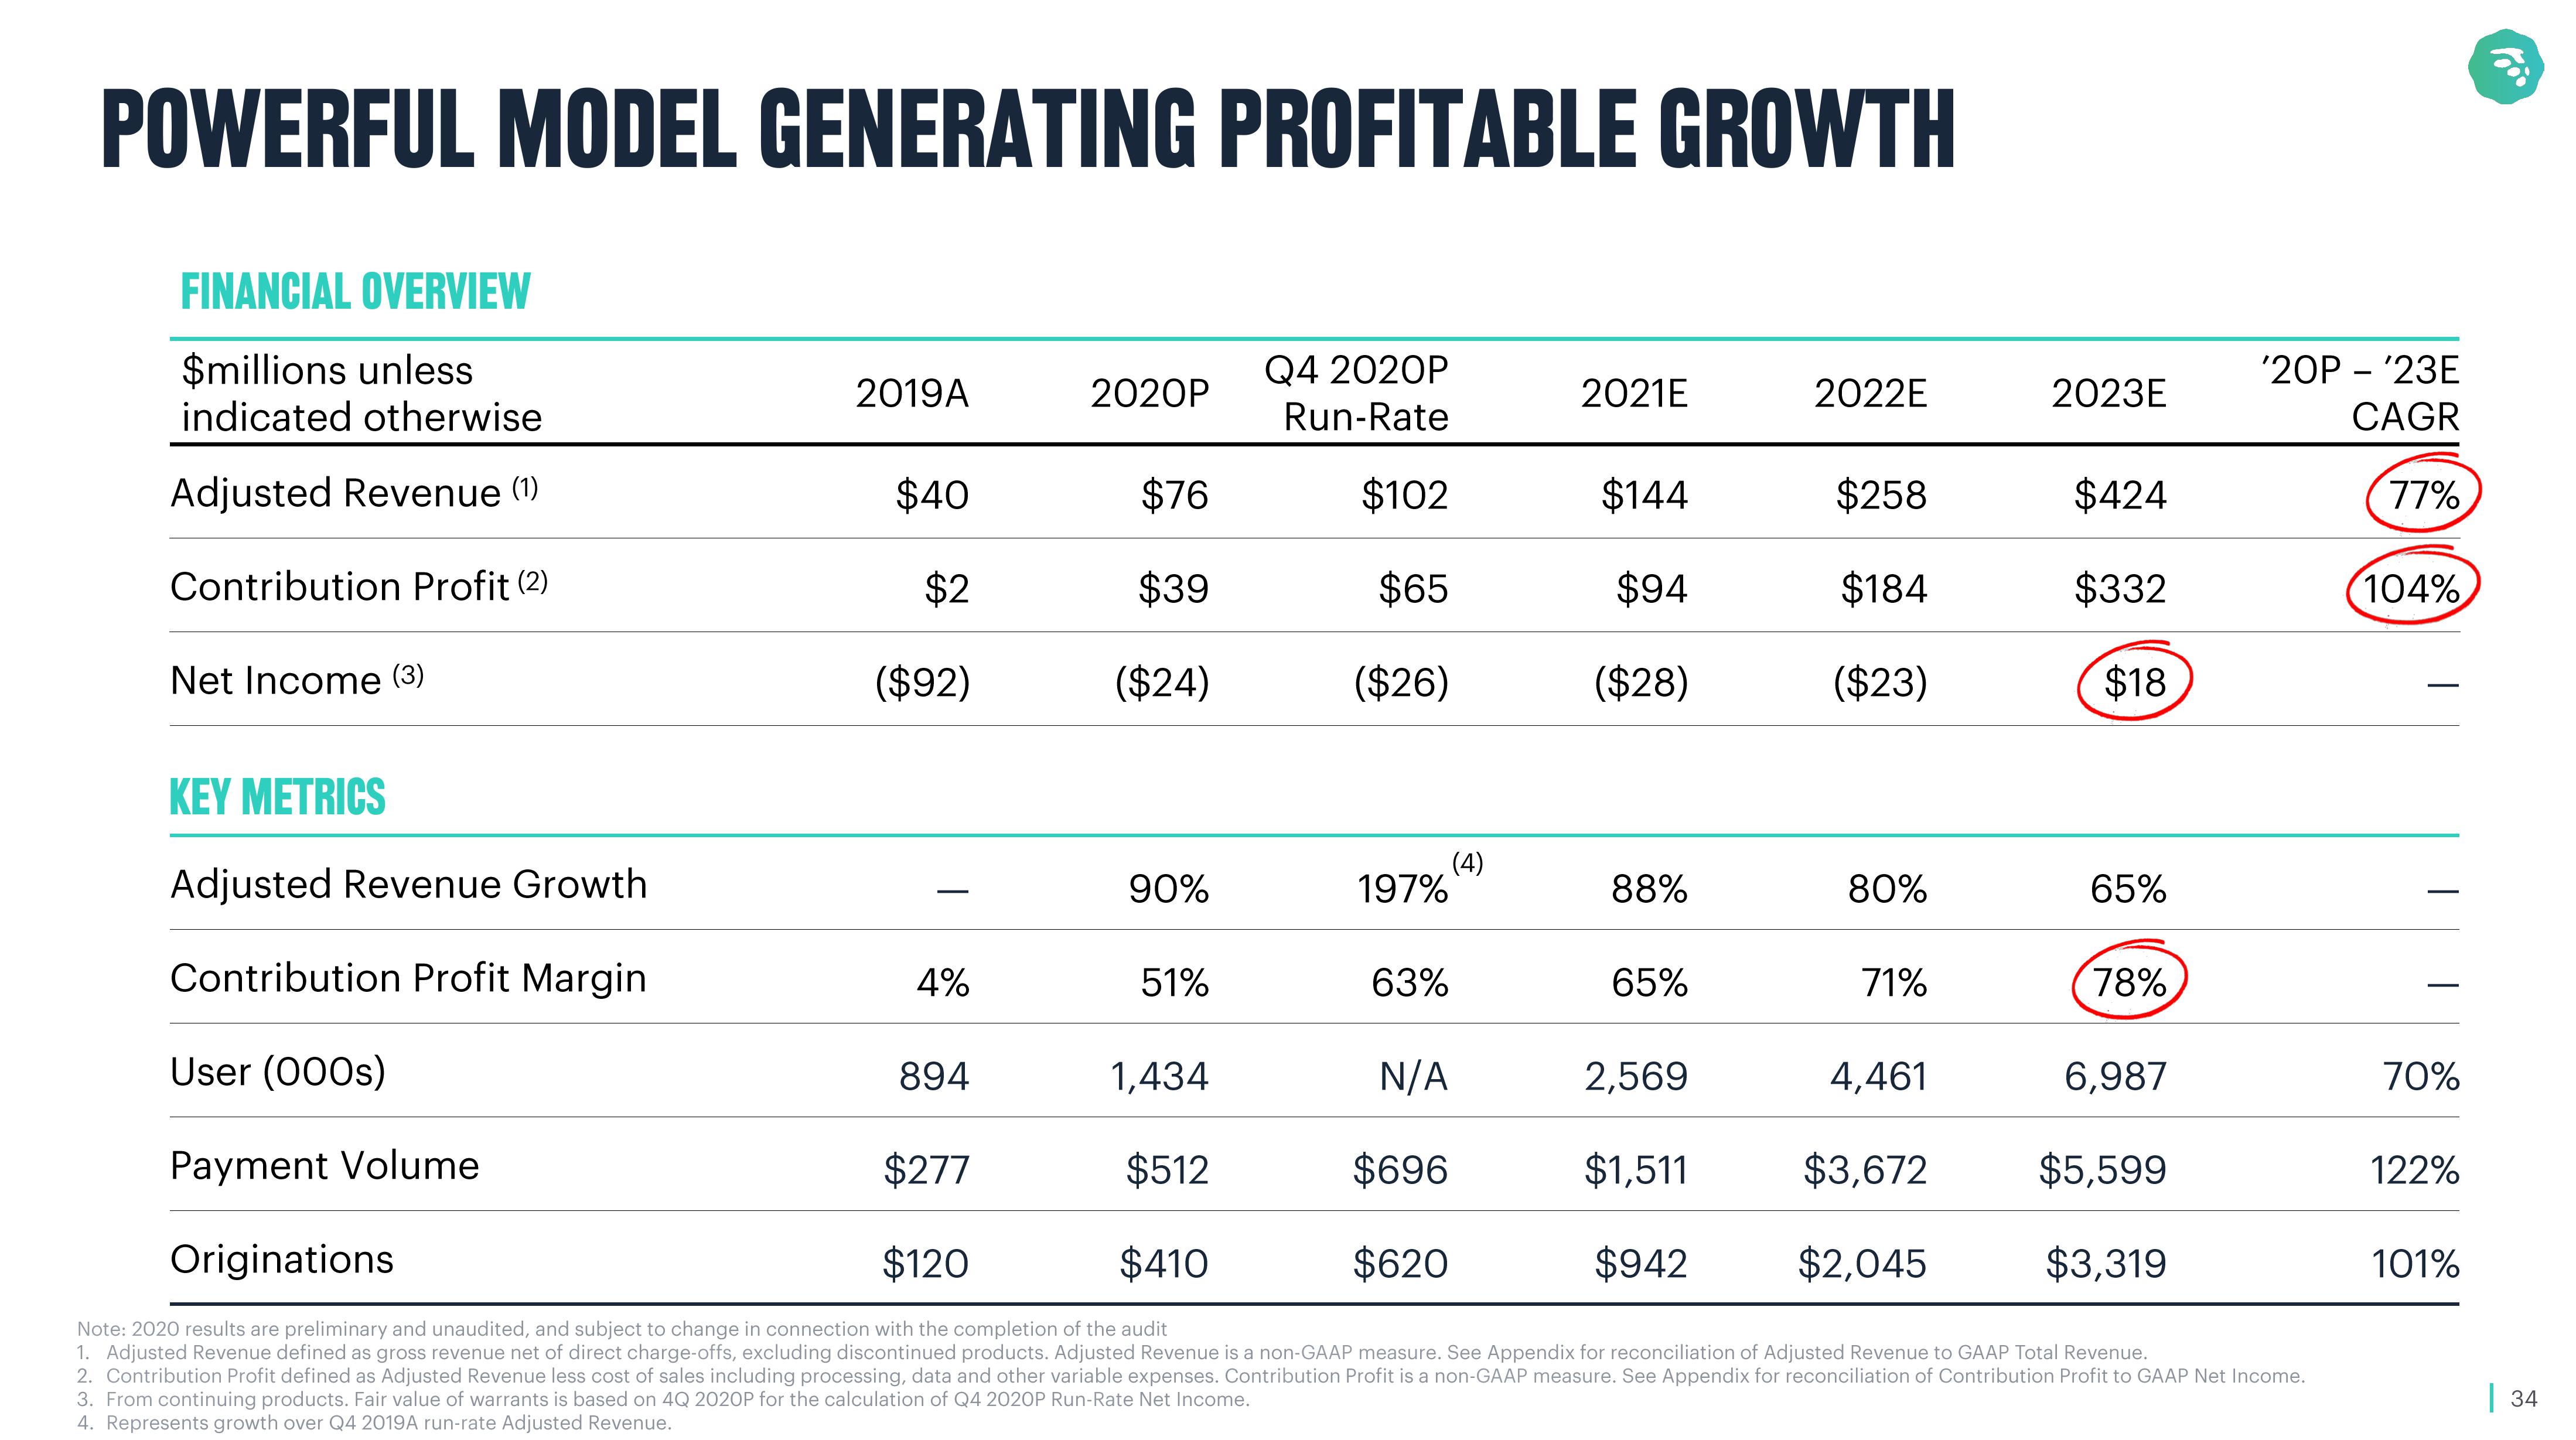
POWERFUL MODEL GENERATING PROFITABLE GROWTH
FINANCIAL OVERVIEW
$millions unless
indicated otherwise
Adjusted Revenue (1)
Contribution Profit (2)
Net Income (3)
KEY METRICS
Adjusted Revenue Growth
Contribution Profit Margin
User (000s)
Payment Volume
Originations
2019A
$40
$2
($92)
4%
894
2020P
$277
$120
$76
$39
($24)
90%
51%
1,434
Q4 2020P
Run-Rate
$512
$410
$102
$65
($26)
197%
63%
(4)
2021E
$144
$94
($28)
88%
65%
2022E
2,569
$1,511
$942
$258
$184
($23)
80%
71%
2023E
N/A
4,461
6,987
$696
$3,672
$5,599
$620
$2,045
$3,319
Note: 2020 results are preliminary and unaudited, and subject to change in connection with the completion of the audit
1. Adjusted Revenue defined as gross revenue net of direct charge-offs, excluding discontinued products. Adjusted Revenue is a non-GAAP measure. See Appendix for reconciliation of Adjusted Revenue to GAAP Total Revenue.
2. Contribution Profit defined as Adjusted Revenue less cost of sales including processing, data and other variable expenses. Contribution Profit is a non-GAAP measure. See Appendix for reconciliation of Contribution Profit to GAAP Net Income.
3. From continuing products. Fair value of warrants is based on 4Q 2020P for the calculation of Q4 2020P Run-Rate Net Income.
4. Represents growth over Q4 2019A run-rate Adjusted Revenue.
$424
$332
$18
65%
78%
'20P - '23E
CAGR
77%
104%
70%
122%
101%
| 34View entire presentation