Hilltop Holdings Results Presentation Deck
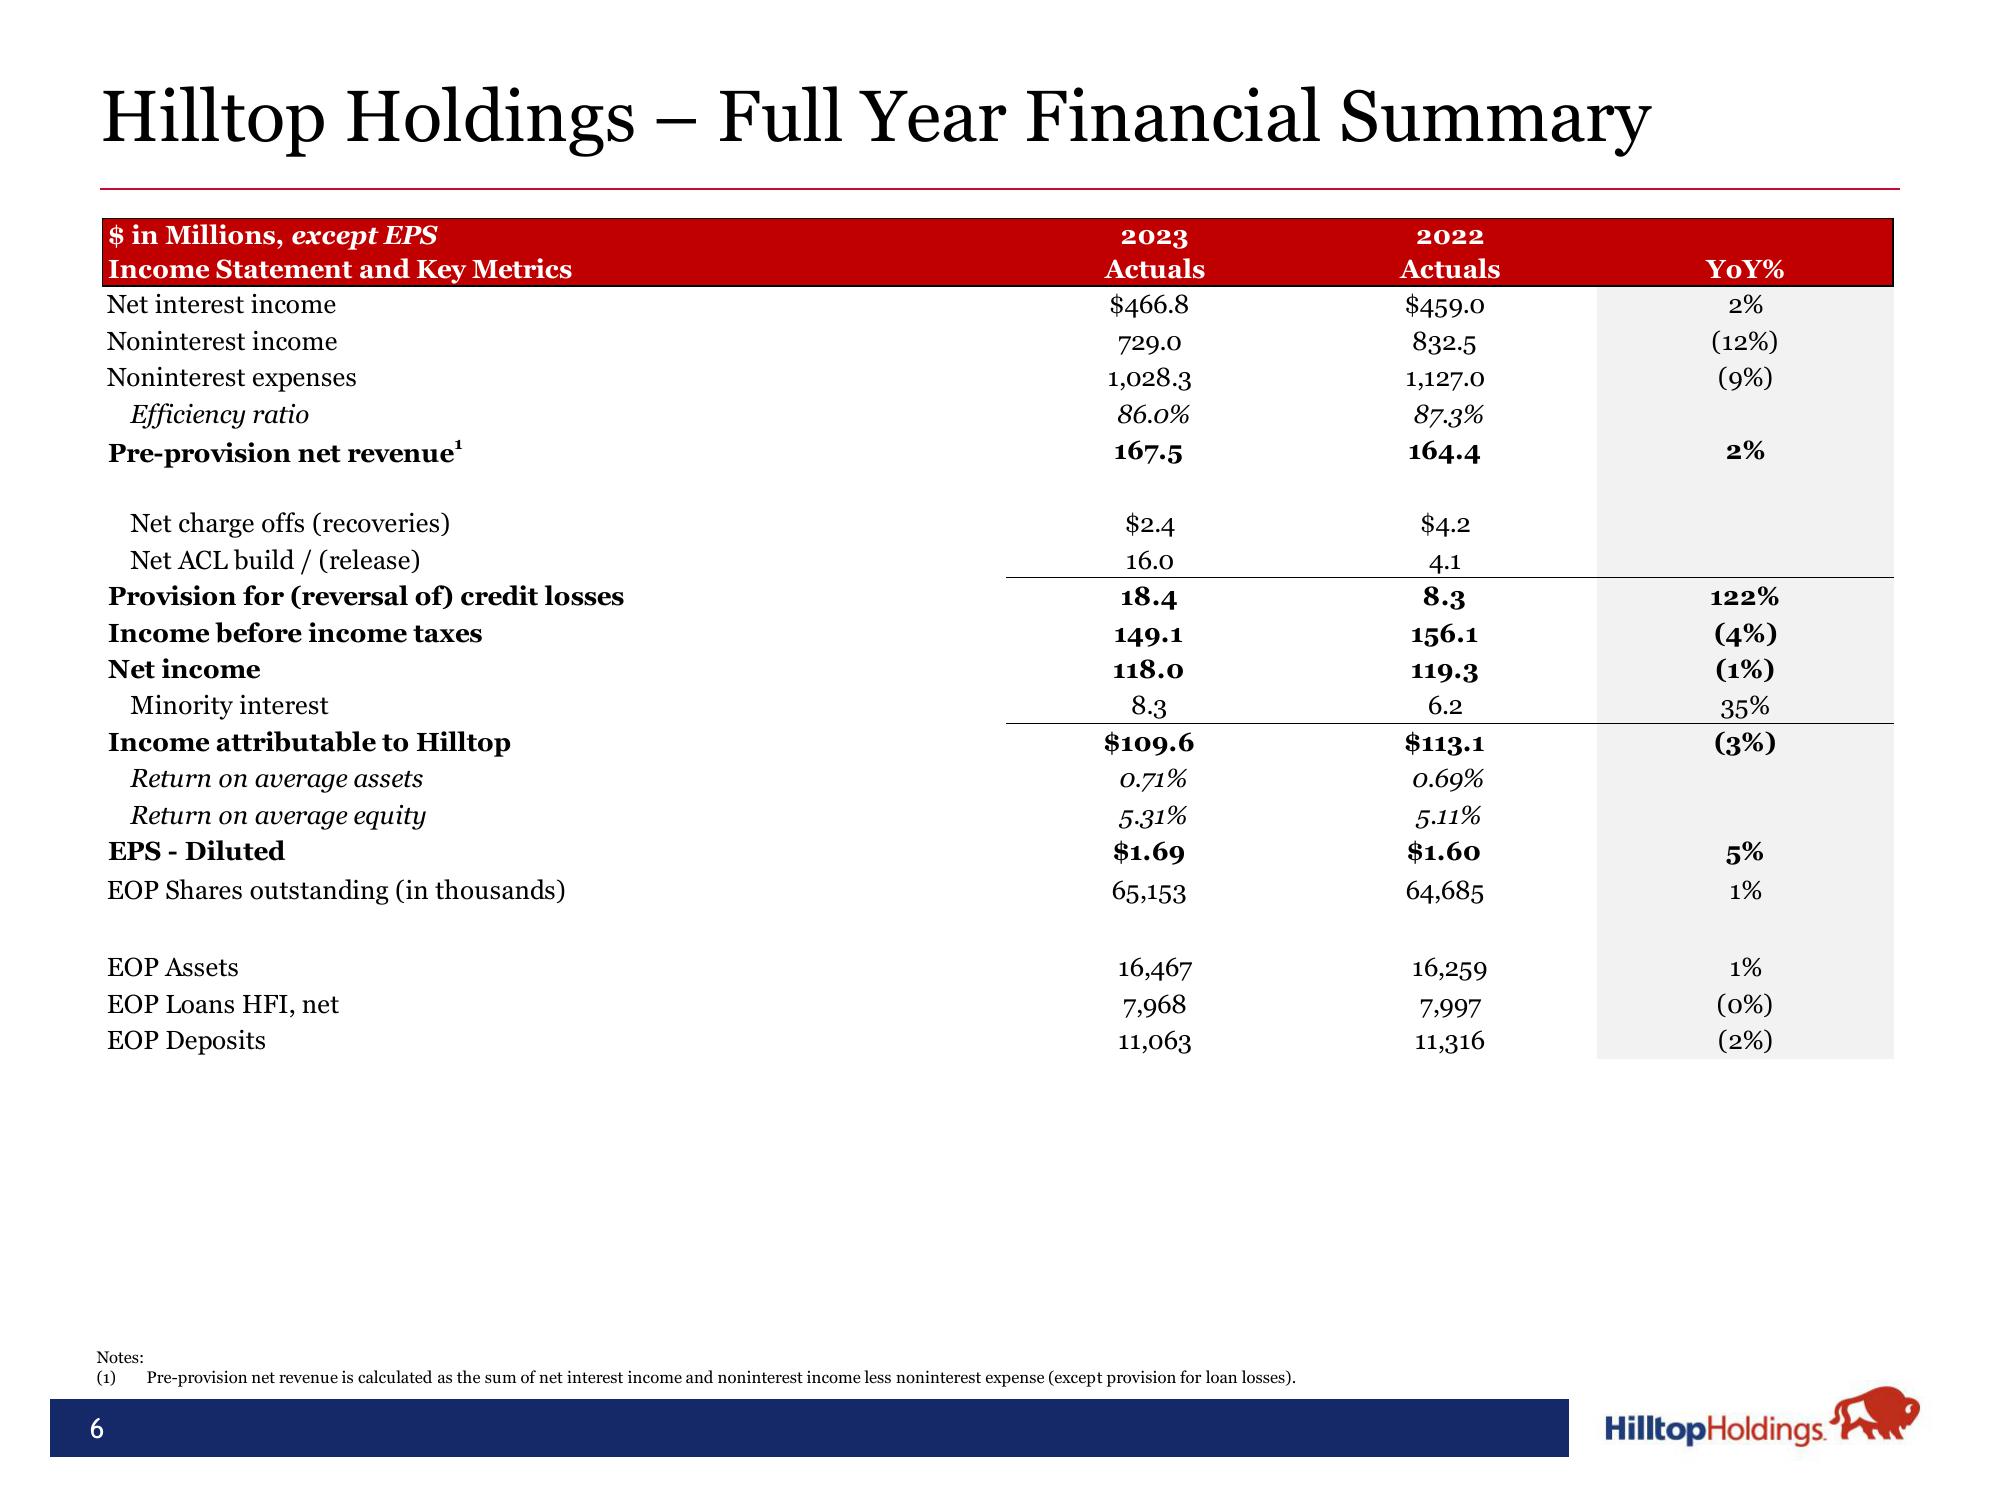
Hilltop Holdings - Full Year Financial Summary
$ in Millions, except EPS
Income Statement and Key Metrics
Net interest income
Noninterest income
Noninterest expenses
Efficiency ratio
Pre-provision net revenue¹
Net charge offs (recoveries)
Net ACL build / (release)
Provision for (reversal of) credit losses
Income before income taxes
Net income
Minority interest
Income attributable to Hilltop
Return on average assets
Return on average equity
EPS-Diluted
EOP Shares outstanding (in thousands)
EOP Assets
EOP Loans HFI, net
EOP Deposits
2023
Actuals
$466.8
729.0
1,028.3
86.0%
167.5
$2.4
16.0
18.4
149.1
118.0
8.3
$109.6
0.71%
5.31%
$1.69
65,153
16,467
7,968
11,063
Notes:
(1) Pre-provision net revenue is calculated as the sum of net interest income and noninterest income less noninterest expense (except provision for loan losses).
2022
Actuals
$459.0
832.5
1,127.0
87.3%
164.4
$4.2
4.1
8.3
156.1
119.3
6.2
$113.1
0.69%
5.11%
$1.60
64,685
16,259
7,997
11,316
YoY%
2%
(12%)
(9%)
2%
122%
(4%)
(1%)
35%
(3%)
5%
1%
1%
(0%)
(2%)
Hilltop Holdings.View entire presentation