Cooper Standard Third Quarter 2023 Earnings Presentation
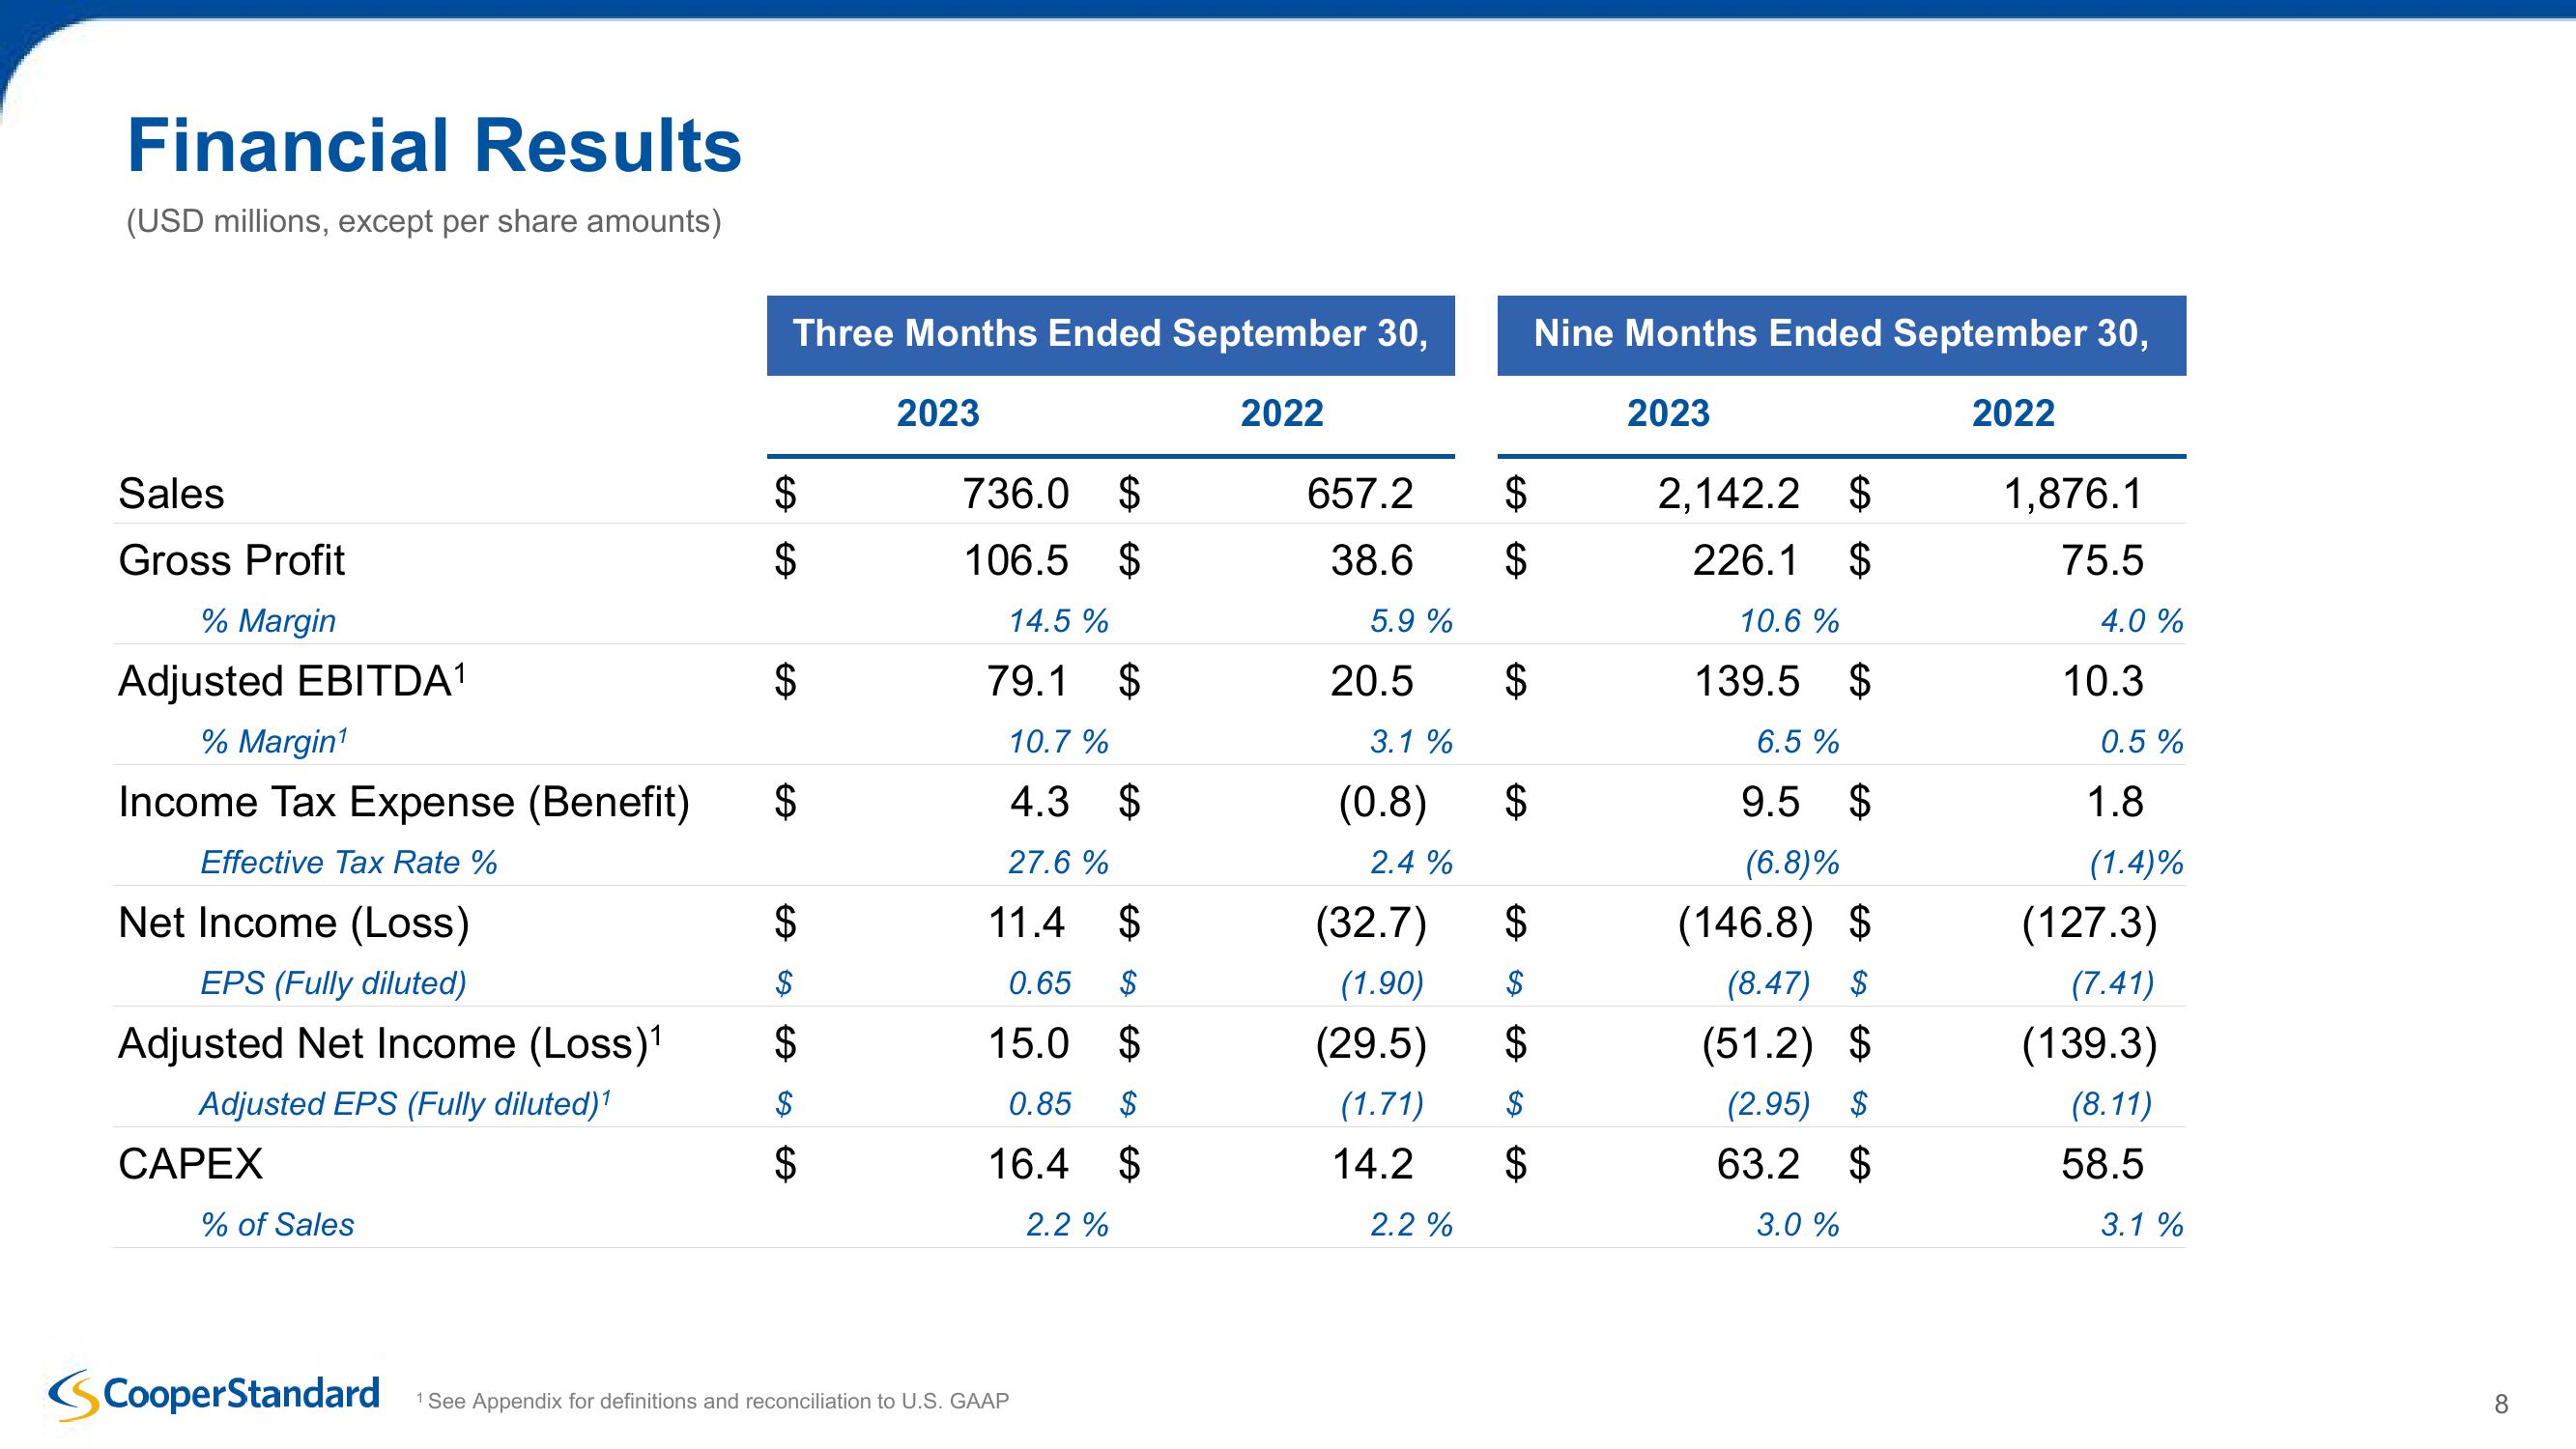
Financial Results
(USD millions, except per share amounts)
Sales
Gross Profit
% Margin
Adjusted EBITDA1
% Margin¹
Income Tax Expense (Benefit)
Effective Tax Rate %
Net Income (Loss)
EPS (Fully diluted)
Adjusted Net Income (Loss) 1
Adjusted EPS (Fully diluted)1
CAPEX
% of Sales
Three Months Ended September 30,
Nine Months Ended September 30,
2023
2022
2023
2022
SS
$
736.0 $
657.2
$
2,142.2 $
1,876.1
$
106.5 $
38.6
$
226.1 $
75.5
14.5 %
5.9%
10.6 %
4.0%
$
79.1 $
20.5
$
10.7 %
3.1 %
SA
$
4.3 $
(0.8)
SA
SA
139.5 $
10.3
6.5%
0.5%
$
9.5 $
1.8
$
SA
27.6 %
11.4
2.4%
(6.8)%
(1.4)%
$
(32.7)
SA
$
(146.8) $
(127.3)
$
0.65 $
(1.90)
69
(8.47) $
$
15.0 $
(29.5) $
(51.2) $
(7.41)
(139.3)
SAS
0.85 $
(1.71)
$
(2.95)
$
(8.11)
$
16.4 $
2.2%
14.2
SA
$
63.2 $
58.5
2.2 %
3.0 %
3.1 %
Cooper Standard
1 See Appendix for definitions and reconciliation to U.S. GAAP
8View entire presentation