Silicon Valley Bank Results Presentation Deck
Expanding international business activity
Billions
Billions
Millions
$5
$2
$1
$16
$14
$12
$10
$8
$6
$4
$2
$0
$75
$60
$45
$30
$15
$1.5
2016
$7.7
$1.11
2016
$28.6
Average Loans
2016
$1.9
Average Client Investment Funds
2017
$9.1
$1.4
$7.7
$2.8
$33.8
2018
2017
Core Fee Income
2017
$12.8
$2.4
$10.4
2018
$54.0
2018
$3.7
svb> Q2 2019 Corporate Overview and Financial Results
YTD'19
$13.6
$2.6
$11.0
YTD'19
$29.9
YTD'19
Off-balance
sheet client
funds
Deposits
Location
U.K.
Israel
China
Description
Full service branch
Business development and
representative office
Business development office
(Beijing)
SPD Silicon Valley Bank
(joint venture, offices in
Shanghai, Beijing, Shenzhen)
Hong
Kong
Germany Branch (lending)
Representative office
Canada Branch (lending)
Year
opened
2012
2008
2005
2012
2013
2018
2019
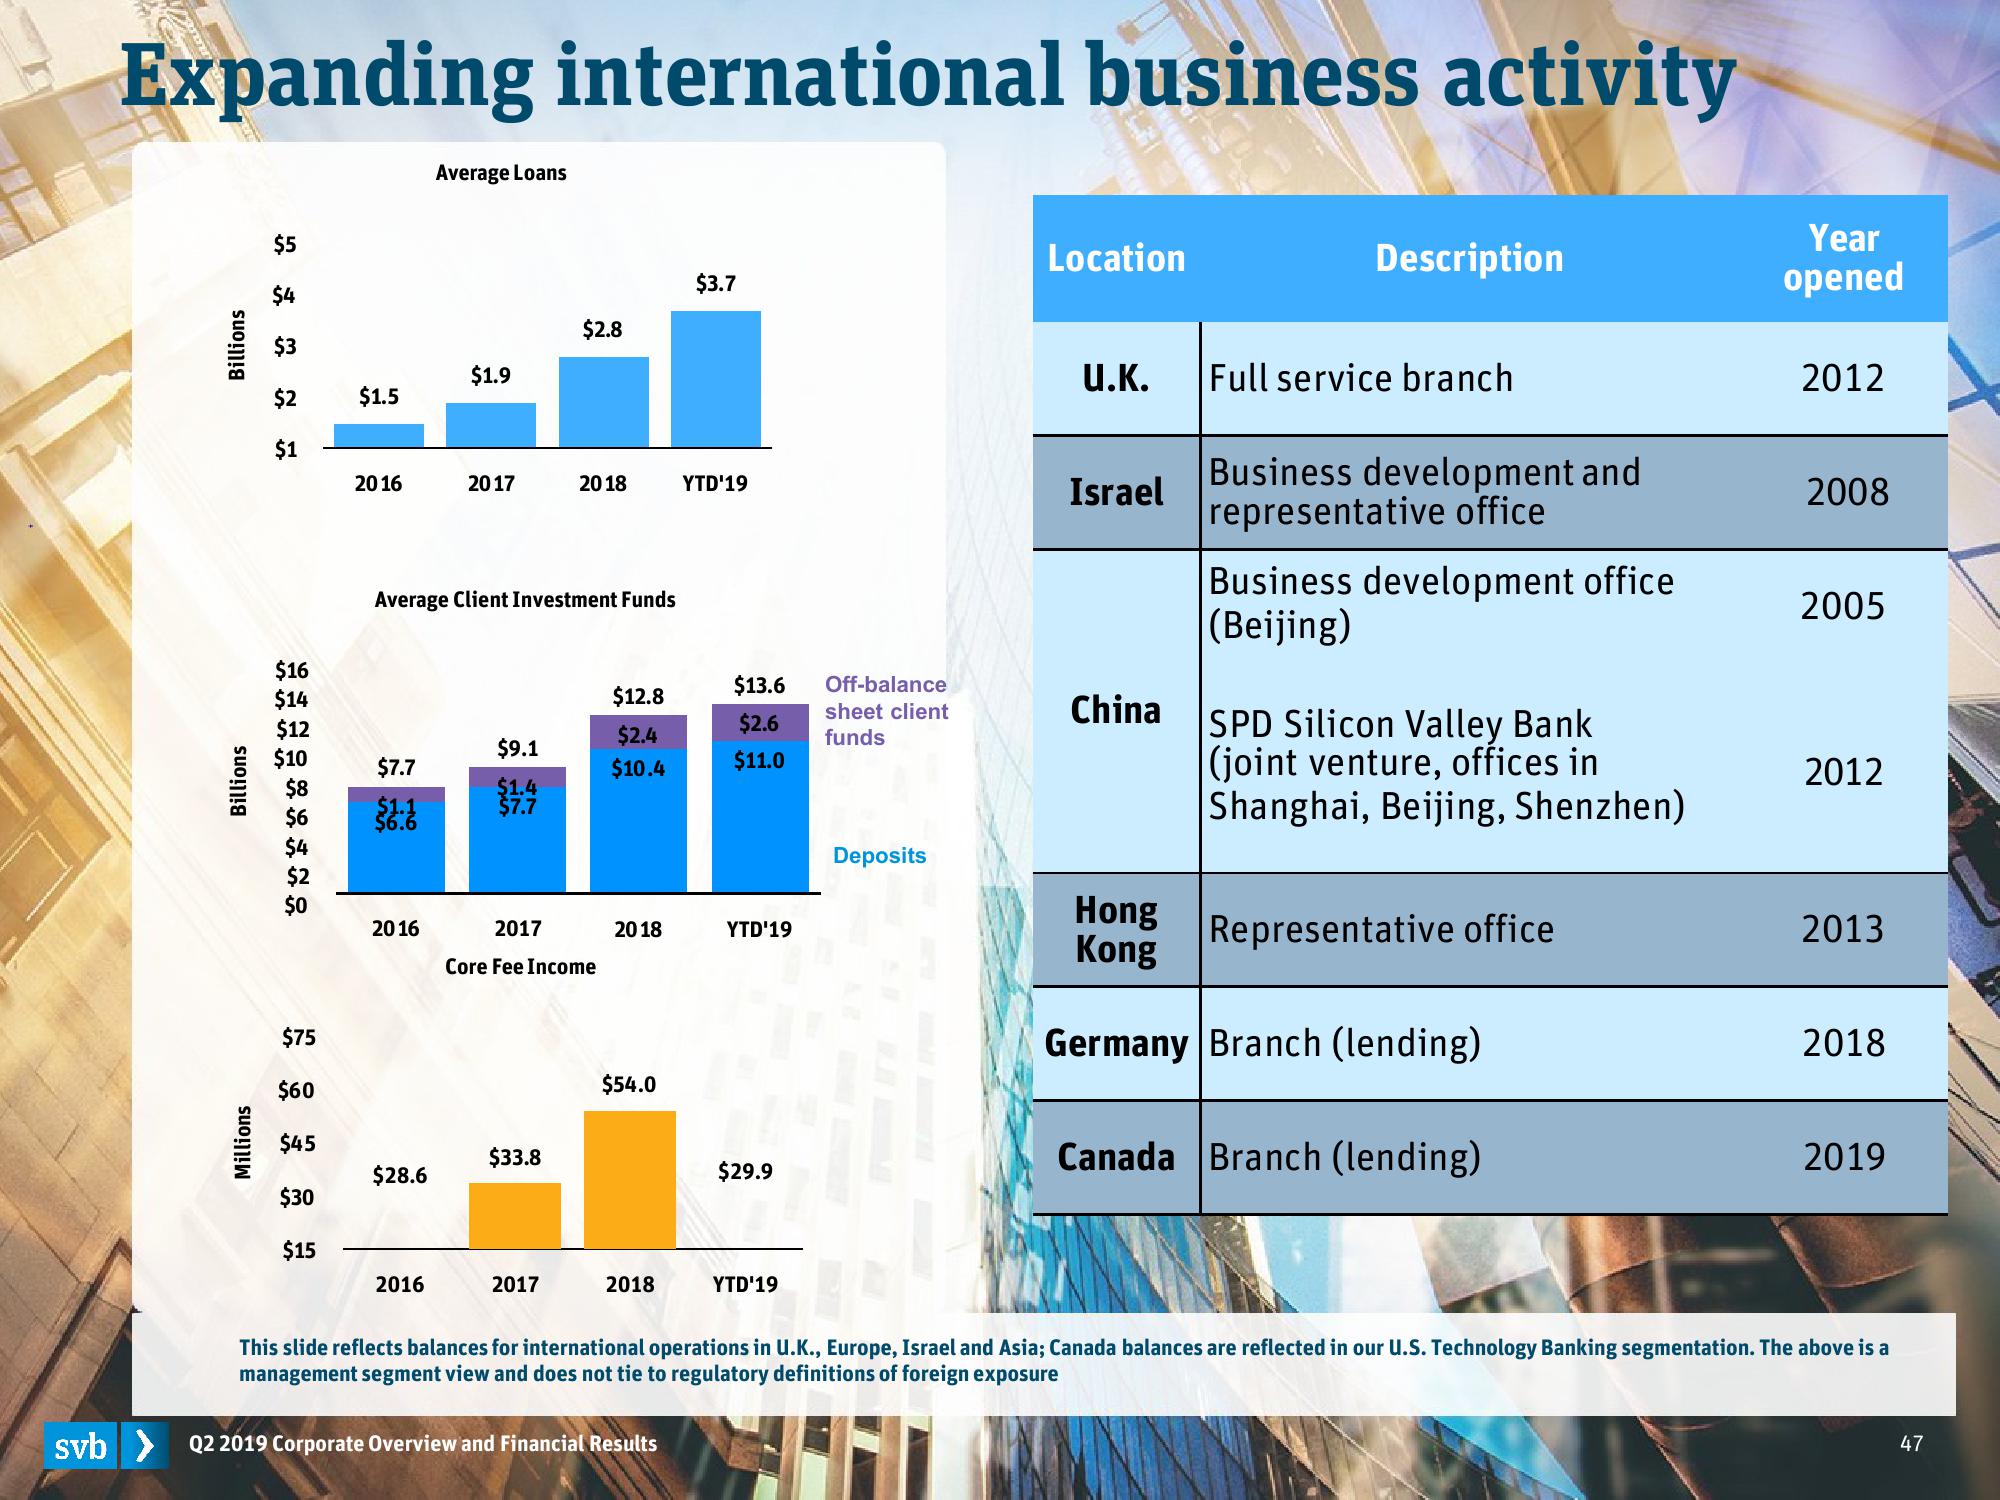
This slide reflects balances for international operations in U.K., Europe, Israel and Asia; Canada balances are reflected in our U.S. Technology Banking segmentation. The above is a
management segment view and does not tie to regulatory definitions of foreign exposure
47View entire presentation