XP Inc Results Presentation Deck
Retail Revenues
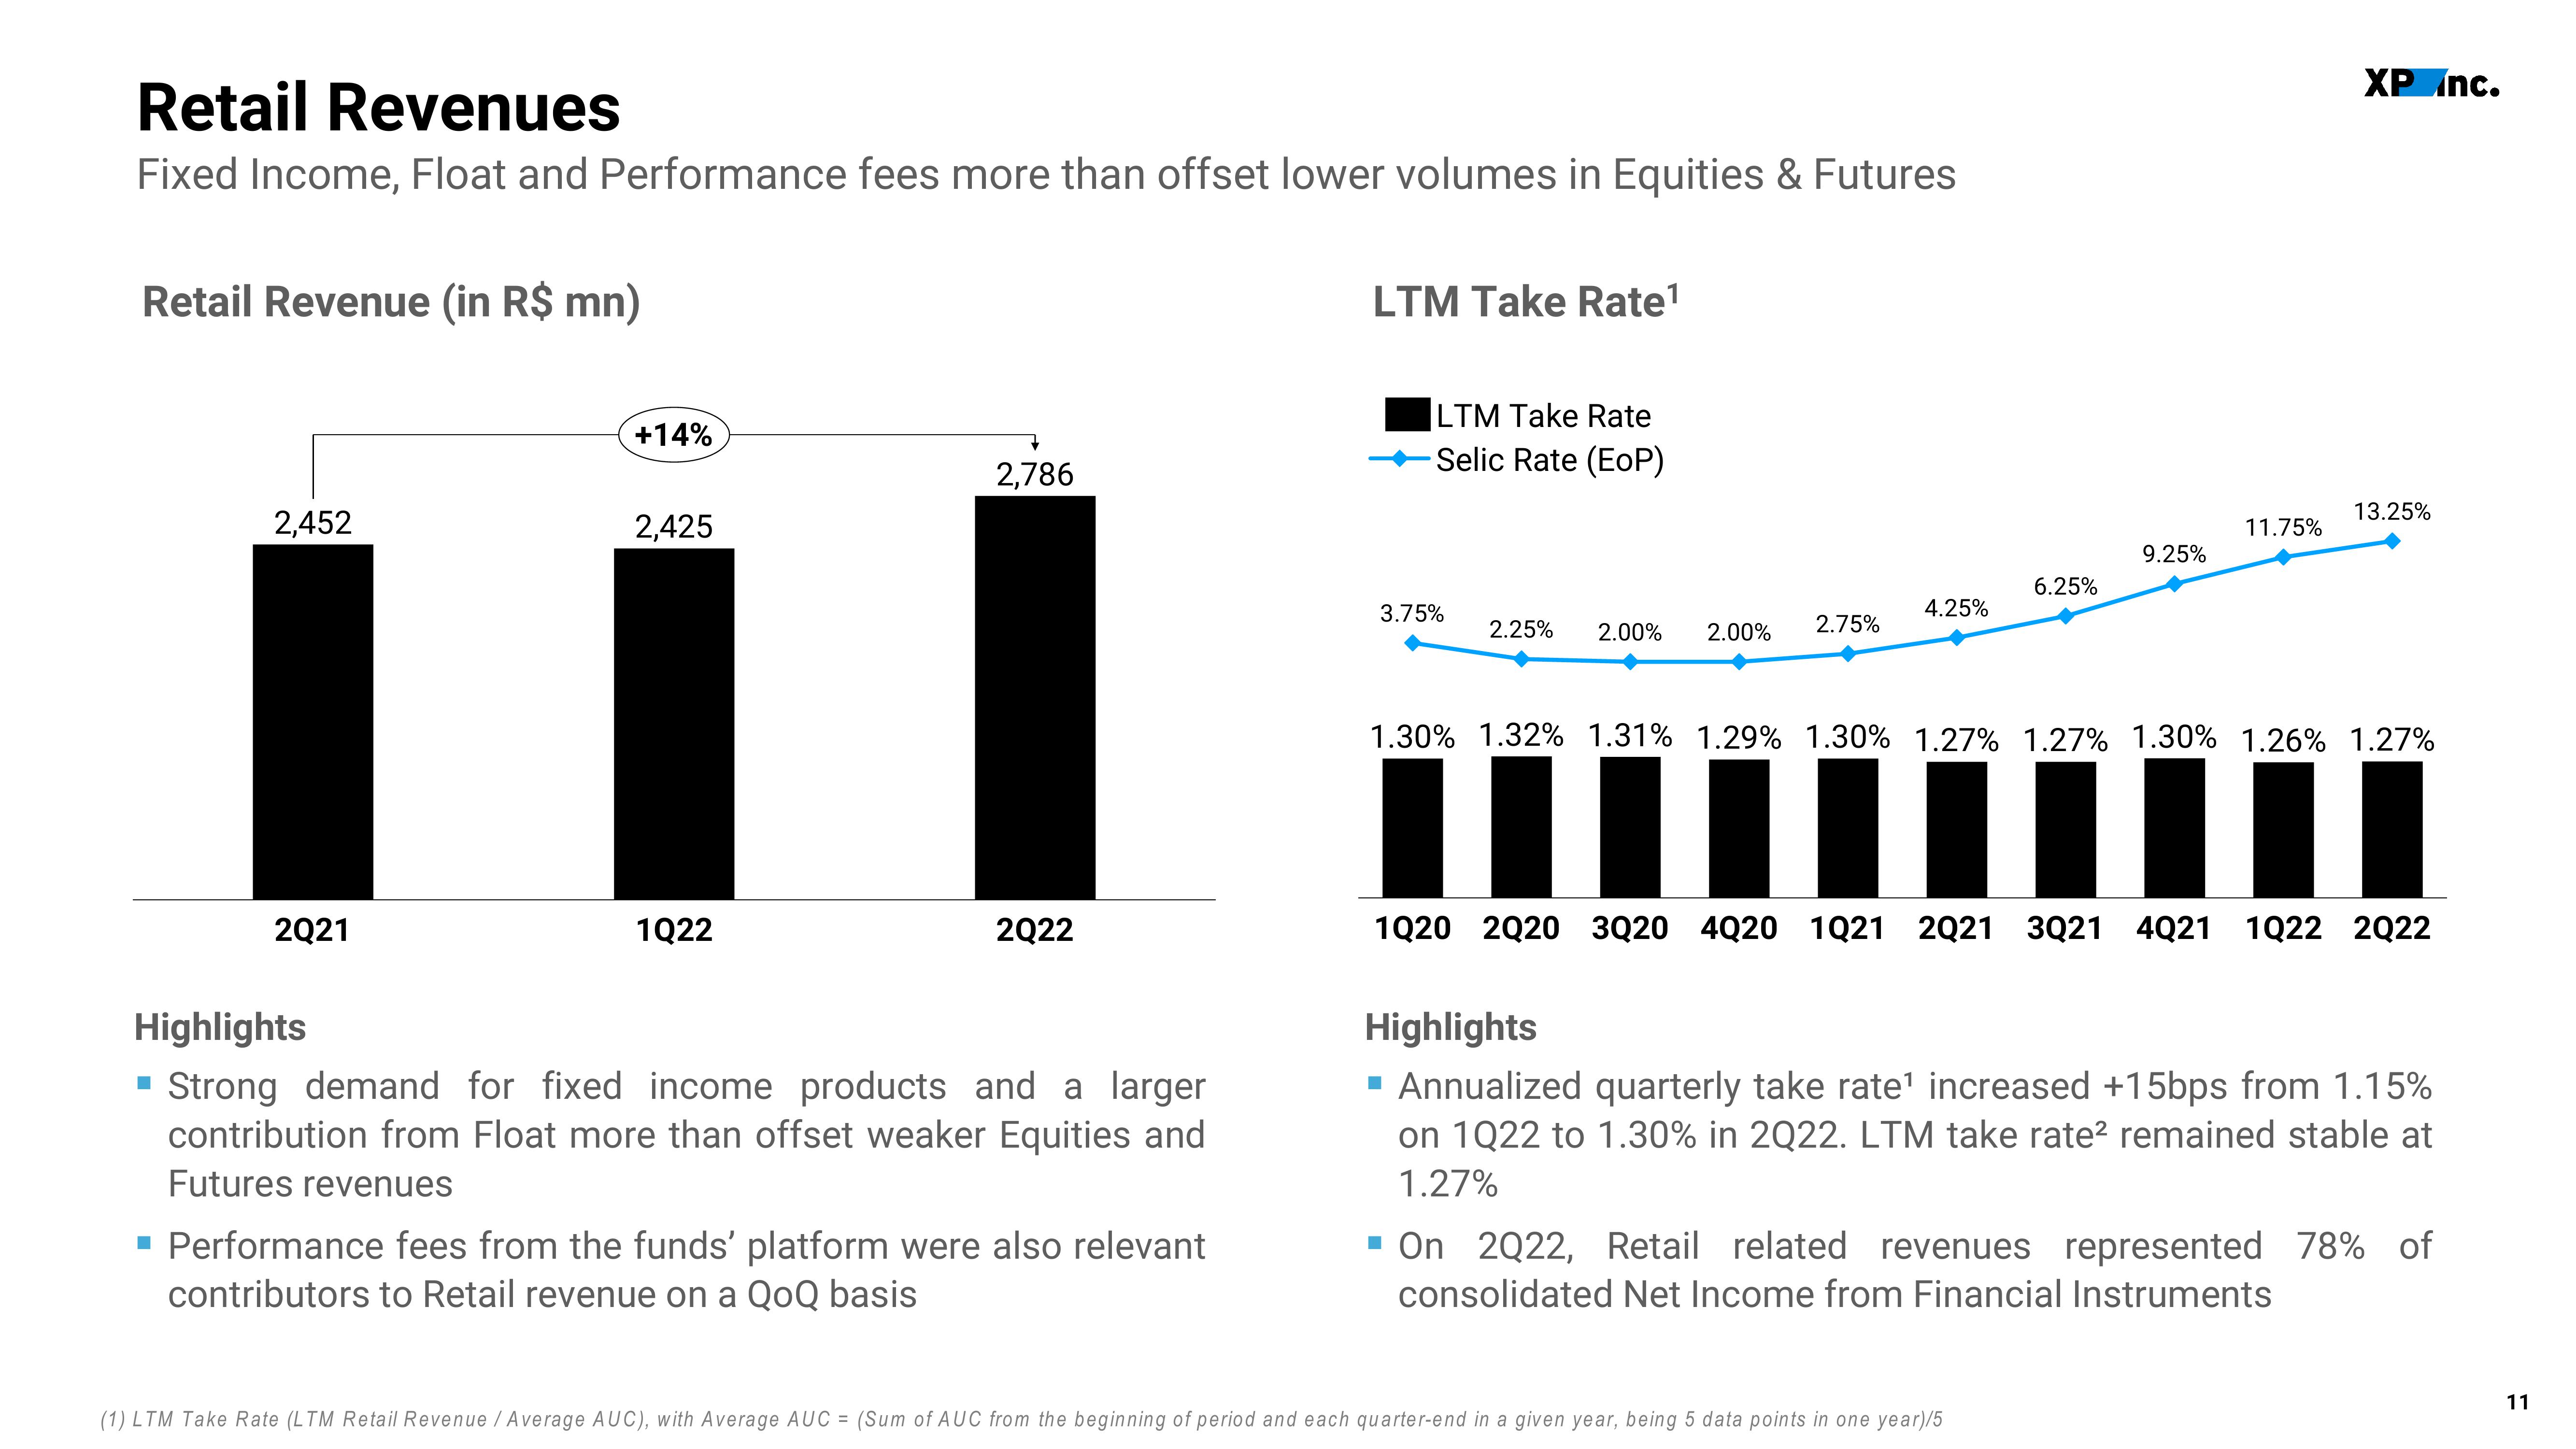
Fixed Income, Float and Performance fees more than offset lower volumes in Equities & Futures
Retail Revenue (in R$ mn)
2,452
2Q21
+14%
2,425
1Q22
2,786
2Q22
Highlights
Strong demand for fixed income products and a larger
contribution from Float more than offset weaker Equities and
Futures revenues
▪ Performance fees from the funds' platform were also relevant
contributors to Retail revenue on a QoQ basis
LTM Take Rate¹
LTM Take Rate
Selic Rate (EOP)
3.75%
2.25% 2.00% 2.00% 2.75%
4.25%
6.25%
9.25%
11.75%
XP Inc.
(1) LTM Take Rate (LTM Retail Revenue / Average AUC), with Average AUC = (Sum of AUC from the beginning of period and each quarter-end in a given year, being 5 data points in one year)/5
13.25%
1.30% 1.32% 1.31% 1.29% 1.30% 1.27% 1.27% 1.30% 1.26% 1.27%
1020 2020 3Q20 4Q20 1021 2021 3Q21 4Q21 1022 2022
Highlights
▪ Annualized quarterly take rate¹ increased +15bps from 1.15%
on 1022 to 1.30% in 2Q22. LTM take rate² remained stable at
1.27%
▪ On 2Q22, Retail related revenues represented 78% of
consolidated Net Income from Financial Instruments
11View entire presentation