HSBC Results Presentation Deck
4021 results summary
$m
NII
Non-NII
Revenue
ECL
Costs
Associates
Adjusted PBT
Significant items and FX translation
Reported PBT
Profit attributable to ordinary shareholders
Reported EPS, $
Impact of sig items on reported EPS, $
FY DPS33, $
Reported ROTE (YTD), %
$bn
Customer loans
Customer deposits
Reported RWAS
CET1 ratio³, %
TNAV per share, $
4Q21
6,788
5,304
12,092
(450)
(8,341)
669
3,970
(1,306)
2,664
1,788
0.09
(0.06)
0.25
8.3
4Q21
1,046
1,711
838
15.8
7.88
4Q20
6,585
5,213
11,798
(1,172)
(9,092)
684
2,218
(833)
1,385
562
0.03
(0.01)
0.15
3.1
3Q21
1,040
1,687
839
15.9
7.81
3%
2%
2%
62%
8%
(2)%
79 %
(57)%
92 %
>100%
$0.06
$(0.05)
$0.10
5.2ppt
A
1%
1%
(0)%
(0.1)ppt
$0.07
Strategy
4021 results
Appendix
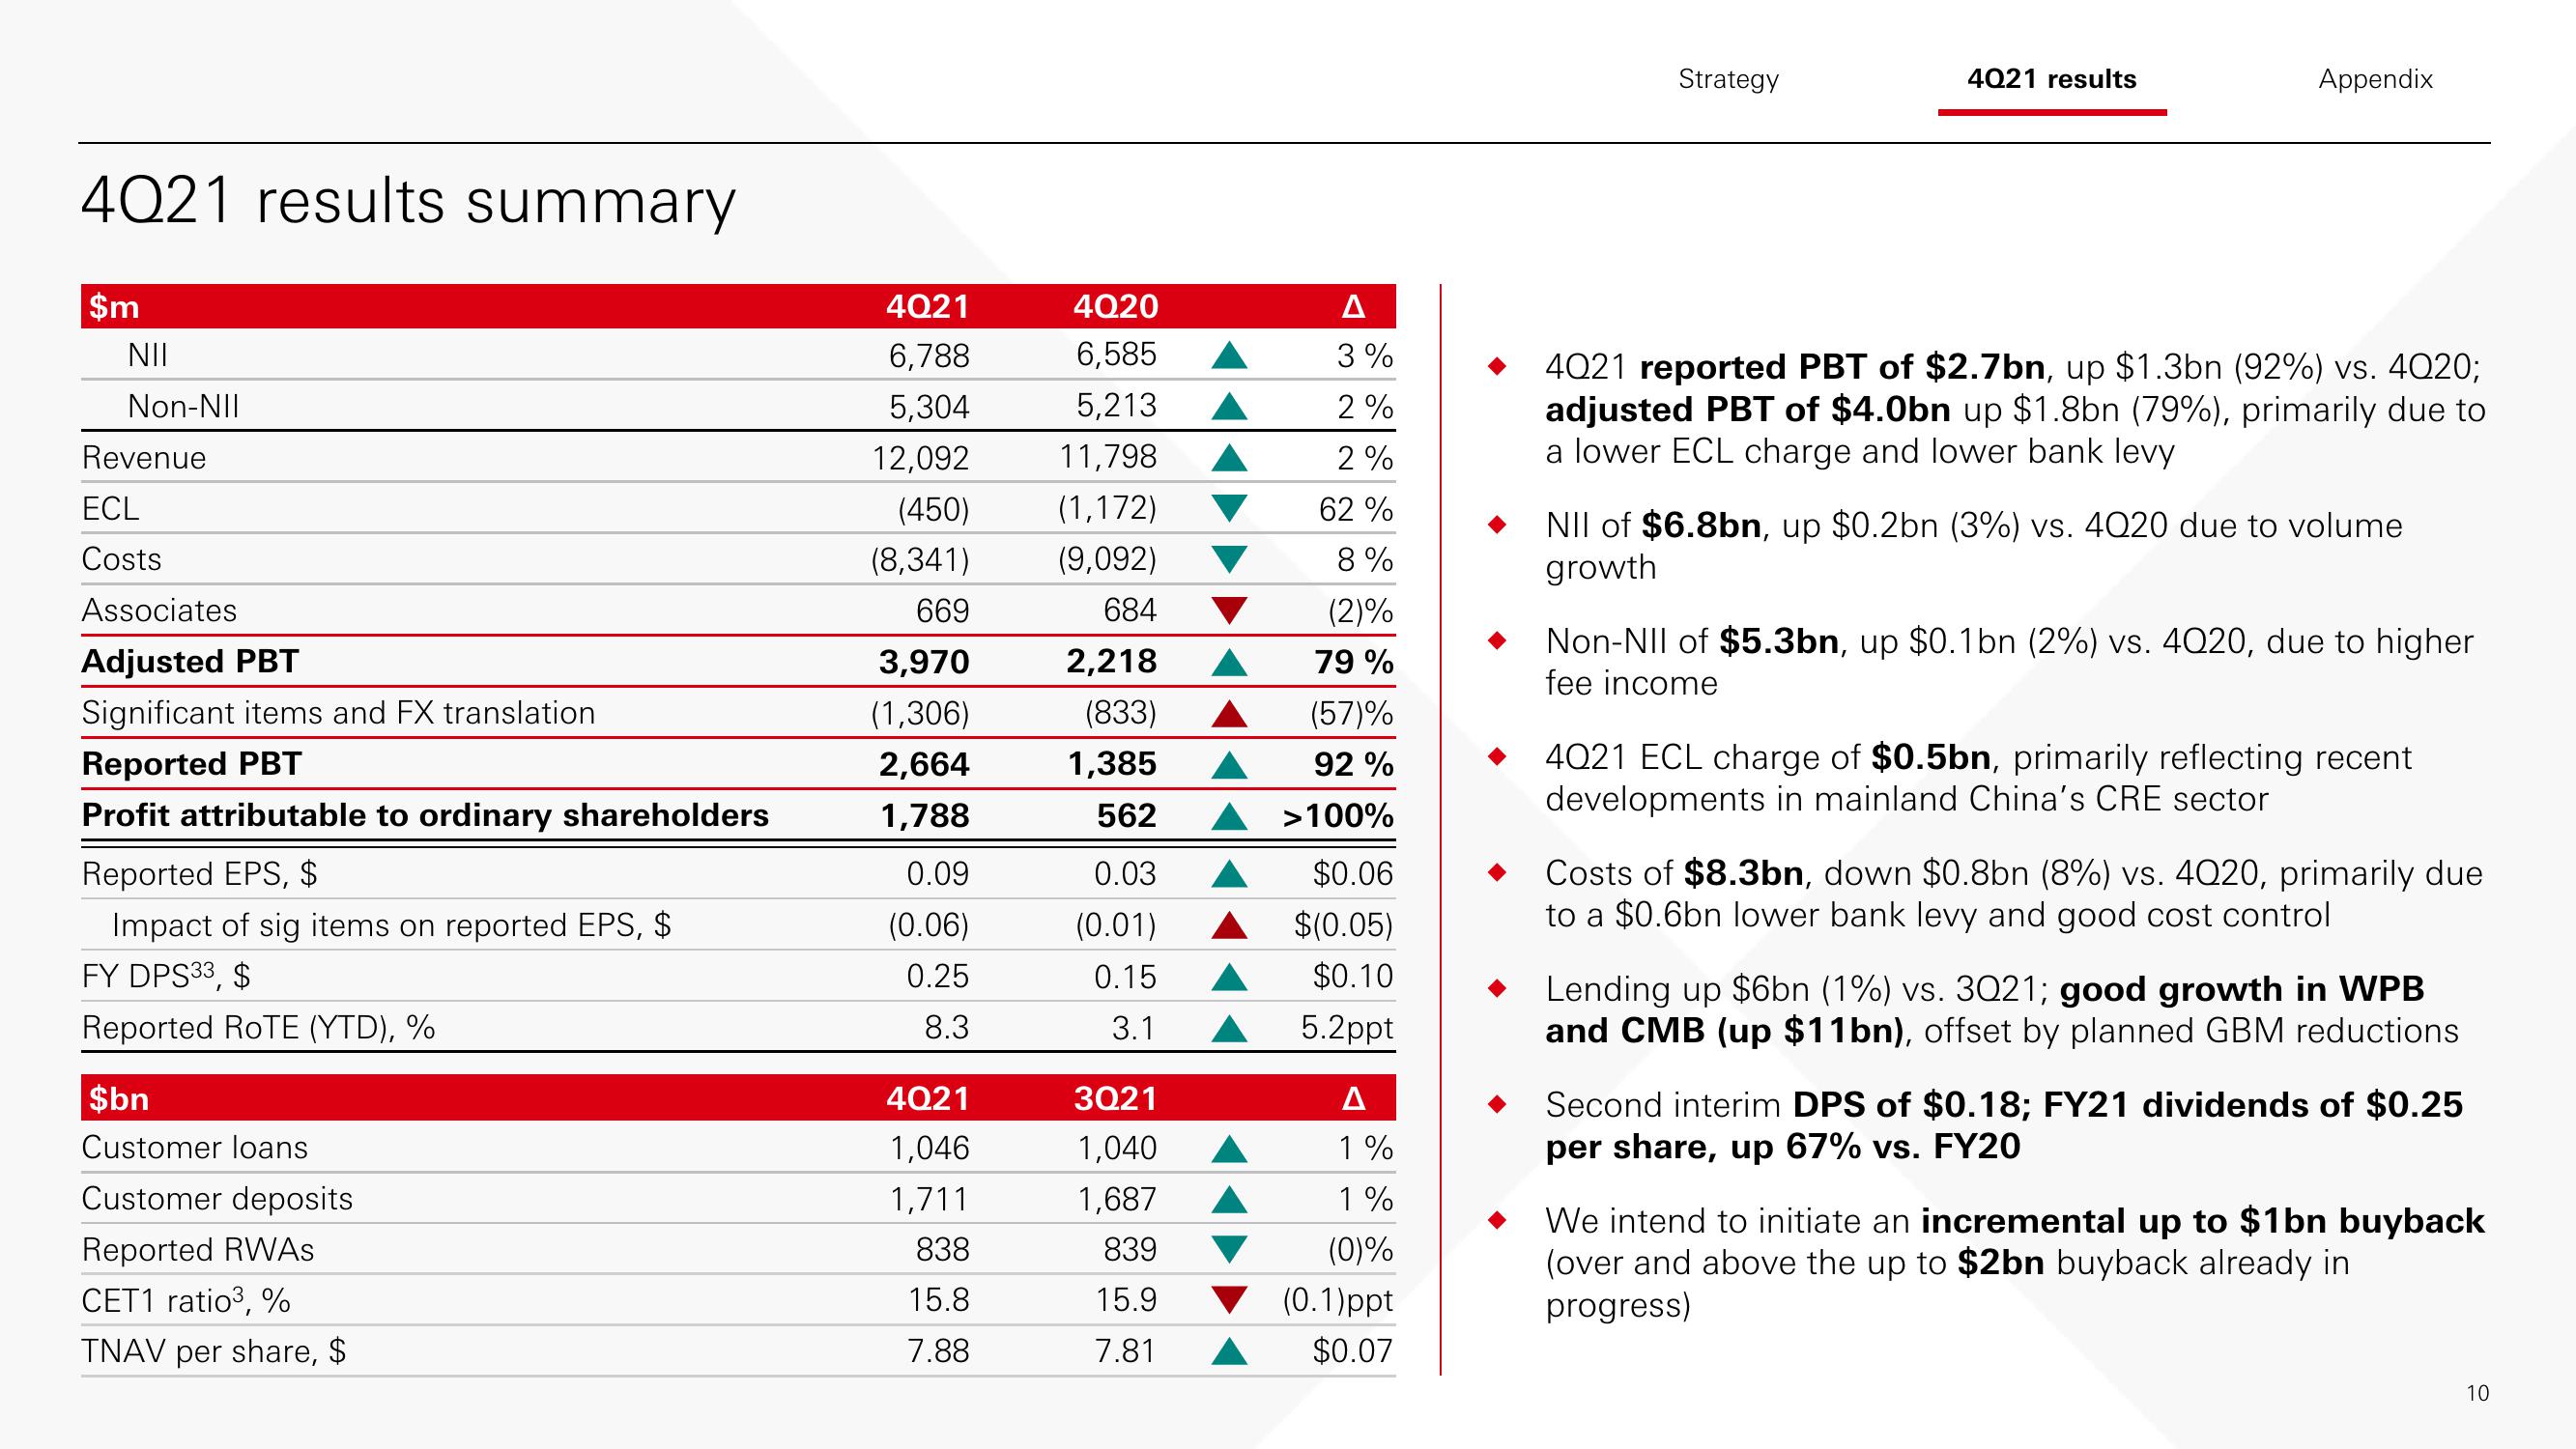
4021 reported PBT of $2.7bn, up $1.3bn (92%) vs. 4Q20;
adjusted PBT of $4.0bn up $1.8bn (79%), primarily due to
a lower ECL charge and lower bank levy
NII of $6.8bn, up $0.2bn (3%) vs. 4Q20 due to volume
growth
Non-NII of $5.3bn, up $0.1bn (2%) vs. 4Q20, due to higher
fee income
4021 ECL charge of $0.5bn, primarily reflecting recent
developments in mainland China's CRE sector
Costs of $8.3bn, down $0.8bn (8%) vs. 4Q20, primarily due
to a $0.6bn lower bank levy and good cost control
Lending up $6bn (1%) vs. 3Q21; good growth in WPB
and CMB (up $11bn), offset by planned GBM reductions
Second interim DPS of $0.18; FY21 dividends of $0.25
per share, up 67% vs. FY20
We intend to initiate an incremental up to $1bn buyback
(over and above the up to $2bn buyback already in
progress)
10View entire presentation