Trian Partners Activist Presentation Deck
Underlying Business Performance Has Not Improved Under David Taylor
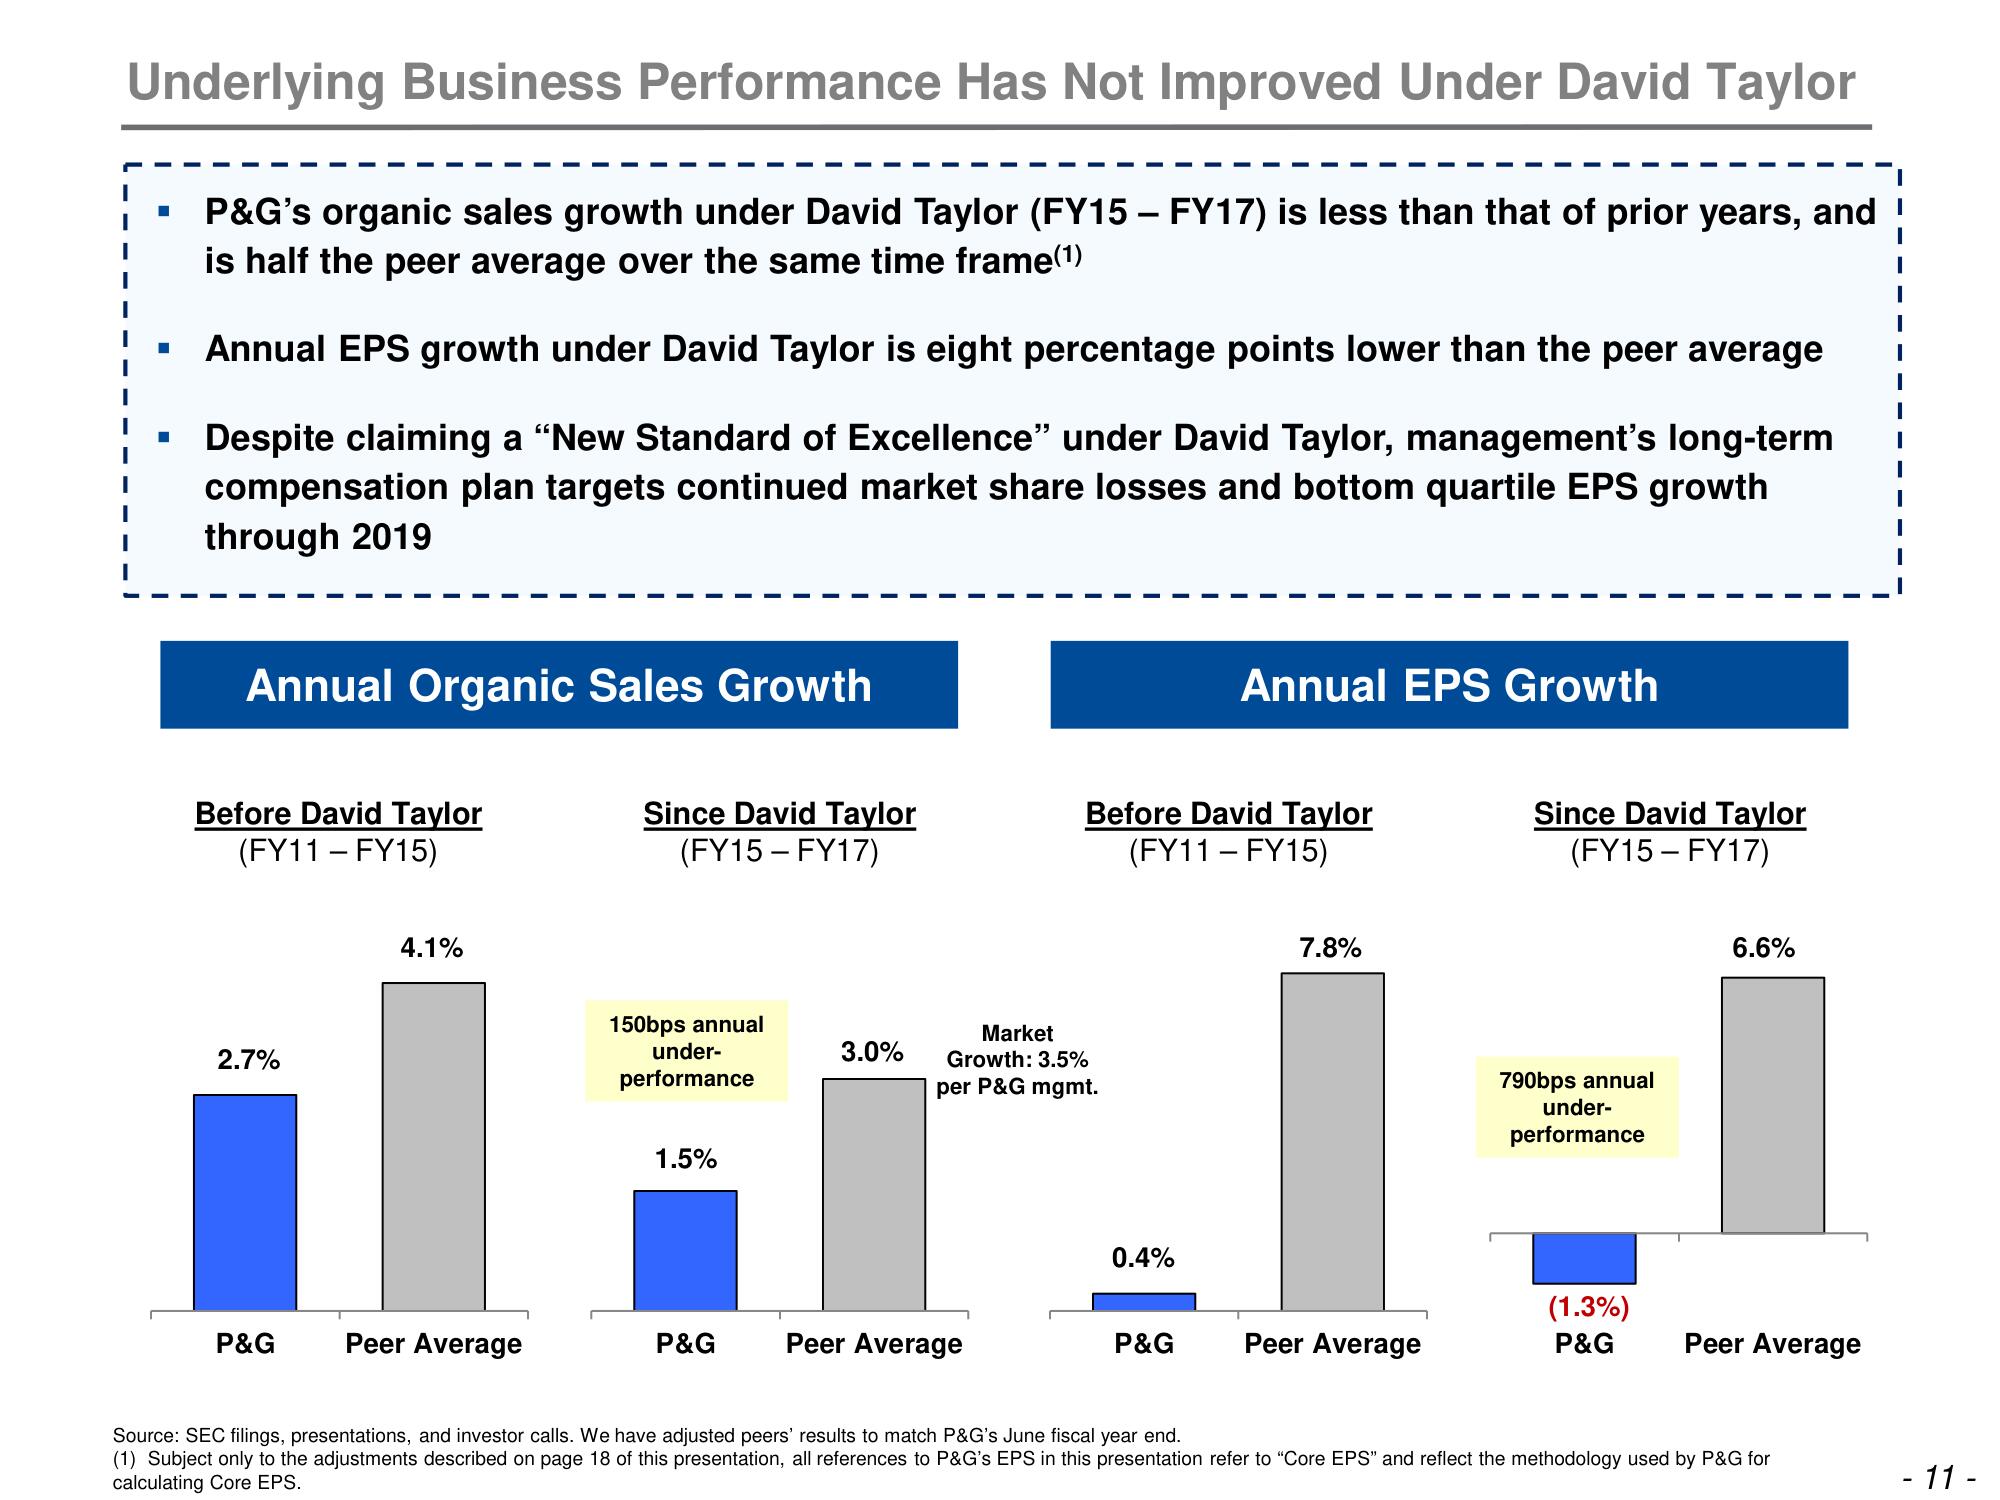
P&G's organic sales growth under David Taylor (FY15 - FY17) is less than that of prior years, and
is half the peer average over the same time frame(¹)
Annual EPS growth under David Taylor is eight percentage points lower than the peer average
Despite claiming a "New Standard of Excellence" under David Taylor, management's long-term
compensation plan targets continued market share losses and bottom quartile EPS growth
through 2019
■
■
■
Annual Organic Sales Growth
Before David Taylor
(FY11-FY15)
2.7%
P&G
4.1%
Peer Average
Since David Taylor
(FY15-FY17)
150bps annual
under-
performance
1.5%
P&G
3.0%
Market
Growth: 3.5%
per P&G mgmt.
Peer Average
Before David Taylor
(FY11-FY15)
0.4%
Annual EPS Growth
P&G
7.8%
Peer Average
Since David Taylor
(FY15-FY17)
790bps annual
under-
performance
(1.3%)
P&G
6.6%
Peer Average
Source: SEC filings, presentations, and investor calls. We have adjusted peers' results to match P&G's June fiscal year end.
(1) Subject only to the adjustments described on page 18 of this presentation, all references to P&G's EPS in this presentation refer to "Core EPS" and reflect the methodology used by P&G for
calculating Core EPS.
I
I
I
I
- 11 -View entire presentation