1Q22 Investor Update
PROFITABILITY TRENDS BY MARKET
Profitability metrics throughout national portfolio
Top 5 Markets by Revenue
Q1 2022
California
Colorado
Massachusetts
Pennsylvania
Virginia
Note: Markets listed alphabetically
40%
43%
49%
45%46%
Overall
56%
Of Total Revenue for
Q1 2022
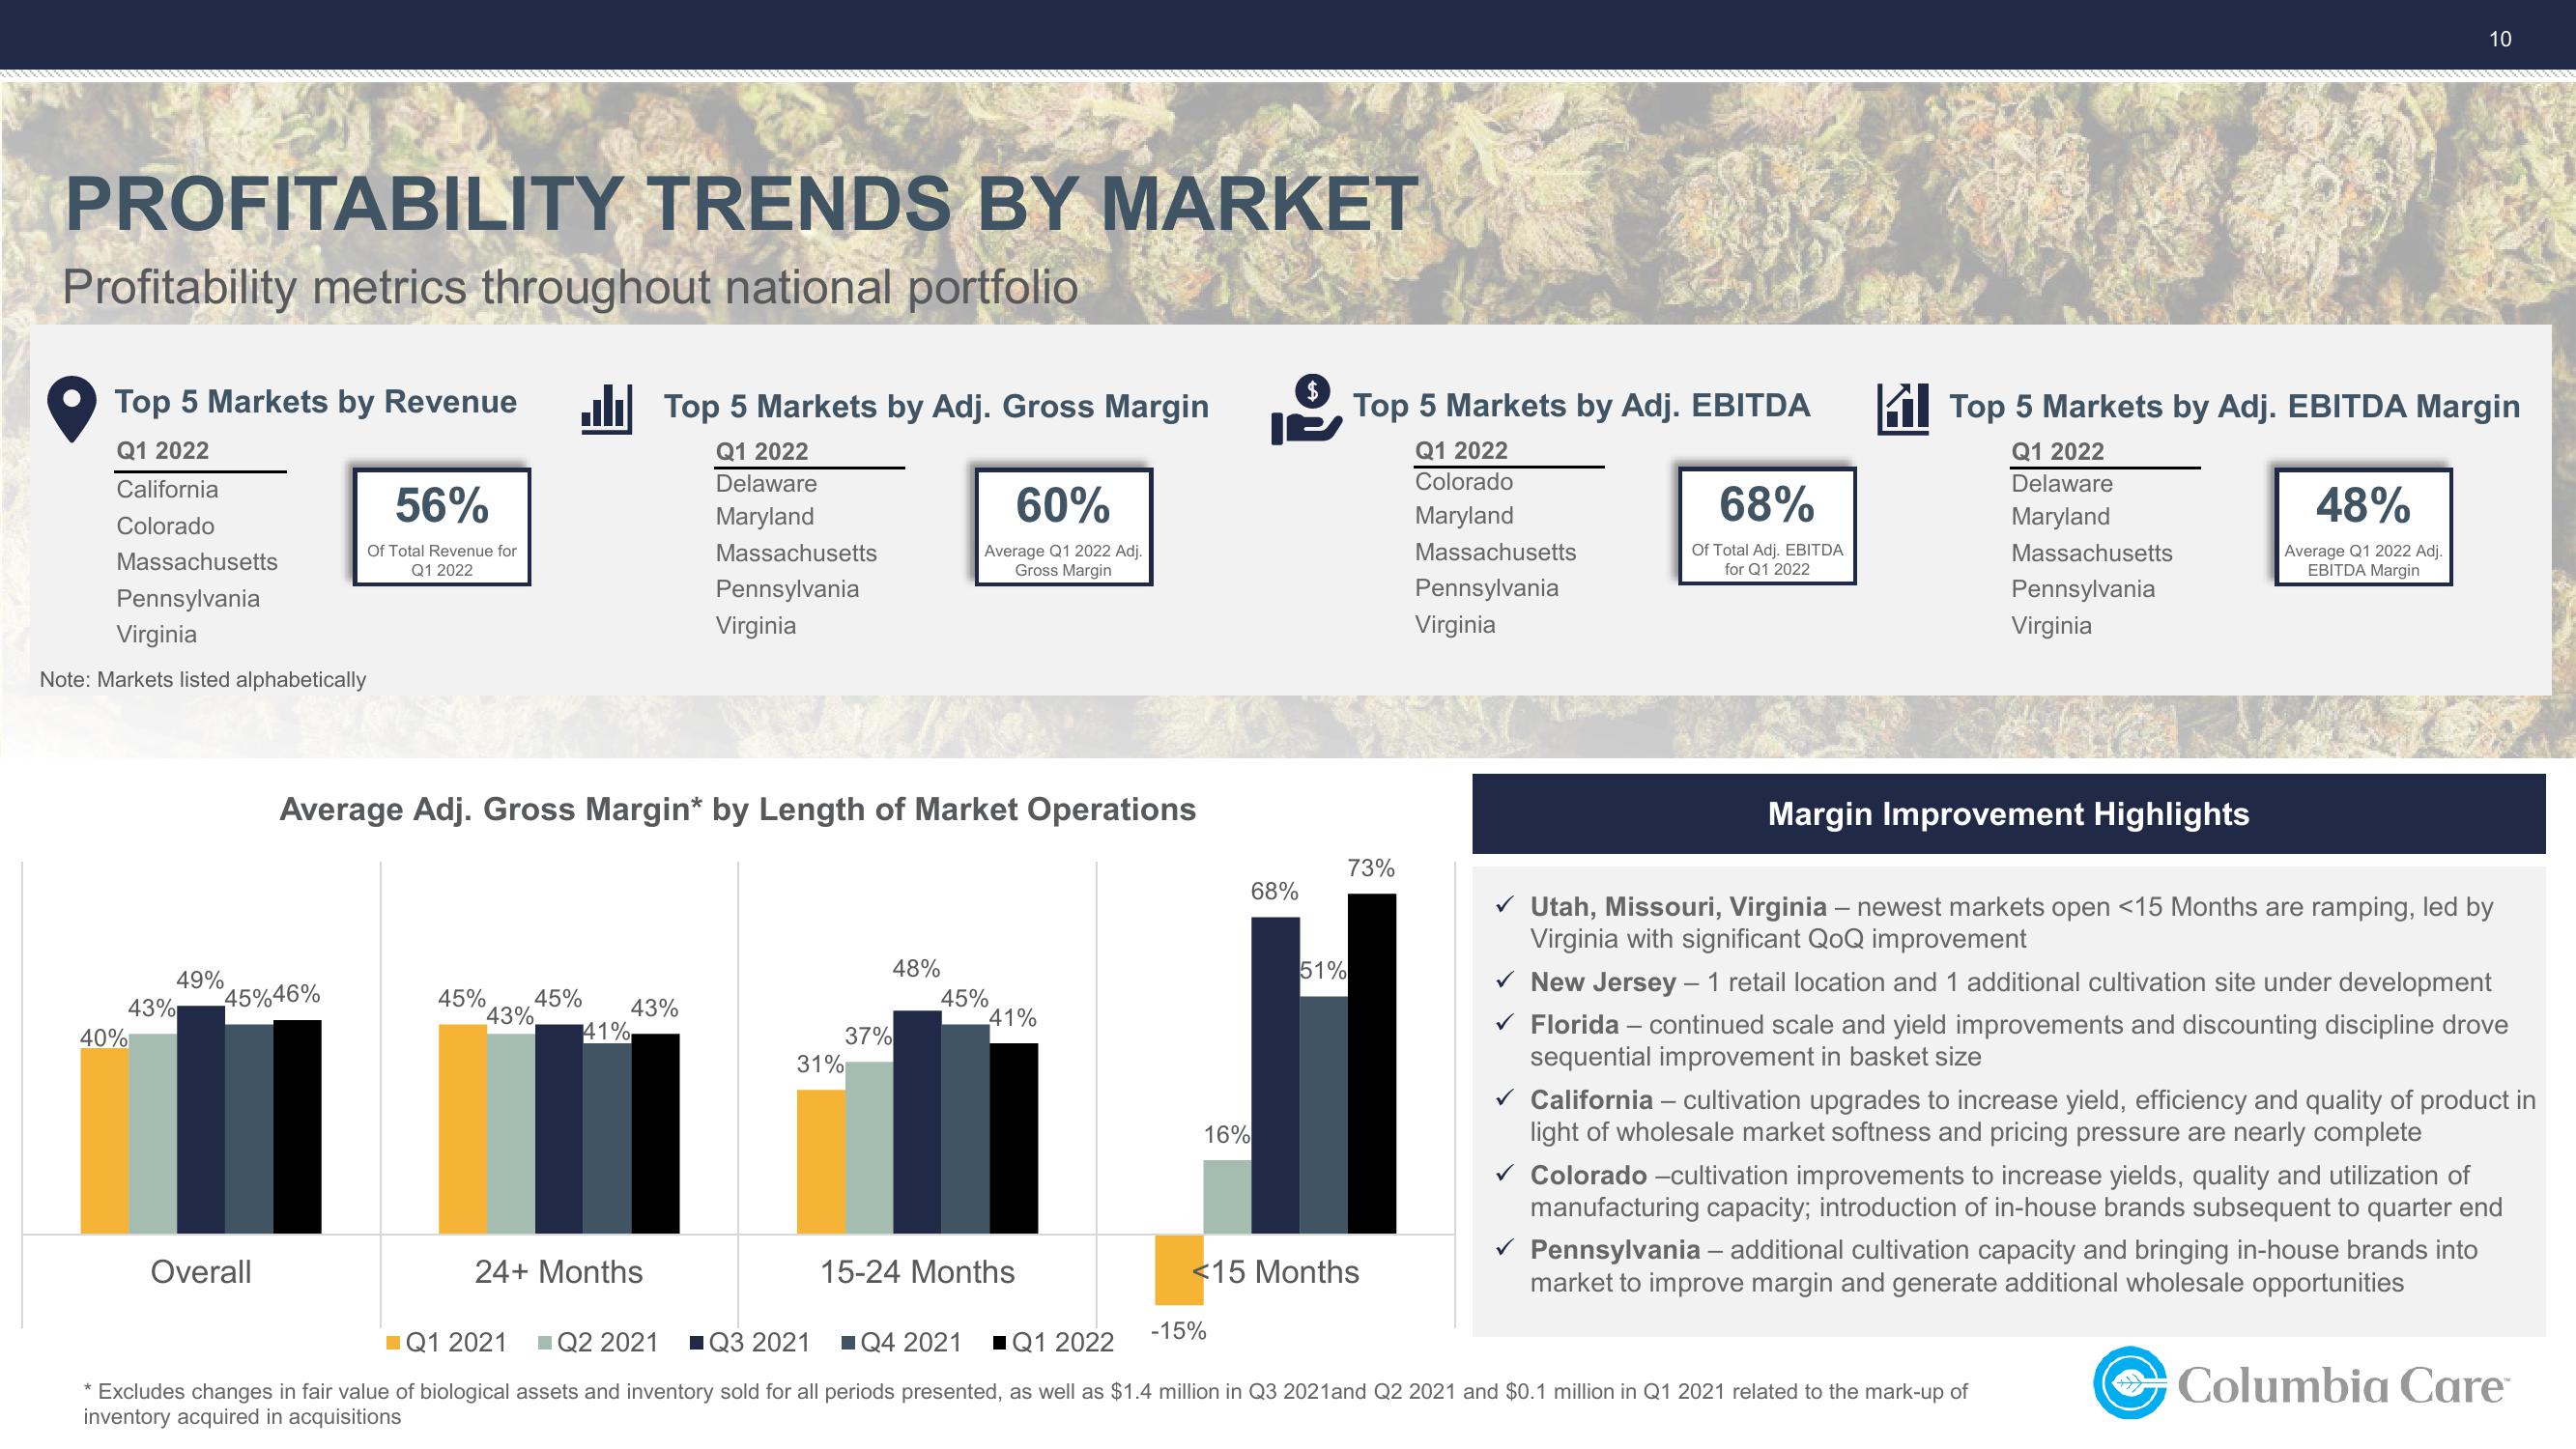
Average Adj. Gross Margin* by Length of Market Operations
45% 45%
43%.
41%
Top 5 Markets by Adj. Gross Margin
Q1 2022
Delaware
Maryland
Massachusetts
Pennsylvania
Virginia
43%
24+ Months
31%
37%
60%
Average Q1 2022 Adj.
Gross Margin
48%
45%
41%
15-24 Months
16%
68%
-15%
Top 5 Markets by Adj. EBITDA
Q1 2022
Colorado
Maryland
Massachusetts
Pennsylvania
Virginia
73%
51%
<15 Months
68%
Of Total Adj. EBITDA
for Q1 2022
Top 5 Markets by Adj. EBITDA Margin
Q1 2022
Delaware
Maryland
Massachusetts
Pennsylvania
Virginia
Margin Improvement Highlights
48%
Average Q1 2022 Adj.
EBITDA Margin
10
✓ Utah, Missouri, Virginia - newest markets open <15 Months are ramping, led by
Virginia with significant QoQ improvement
✓ New Jersey - 1 retail location and 1 additional cultivation site under development
✓ Florida - continued scale and yield improvements and discounting discipline drove
sequential improvement in basket size
✓ California - cultivation upgrades to increase yield, efficiency and quality of product in
light of wholesale market softness and pricing pressure are nearly complete
✓ Colorado -cultivation improvements to increase yields, quality and utilization of
manufacturing capacity; introduction of in-house brands subsequent to quarter end
✓ Pennsylvania - additional cultivation capacity and bringing in-house brands into
market to improve margin and generate additional wholesale opportunities
Q1 2021 Q2 2021 ■Q3 2021
Q4 2021 ■Q1 2022
* Excludes changes in fair value of biological assets and inventory sold for all periods presented, as well as $1.4 million in Q3 2021and Q2 2021 and $0.1 million in Q1 2021 related to the mark-up of
inventory acquired in acquisitions
Columbia Care™View entire presentation