SmileDirectClub Investor Presentation Deck
Marketing & selling.
●
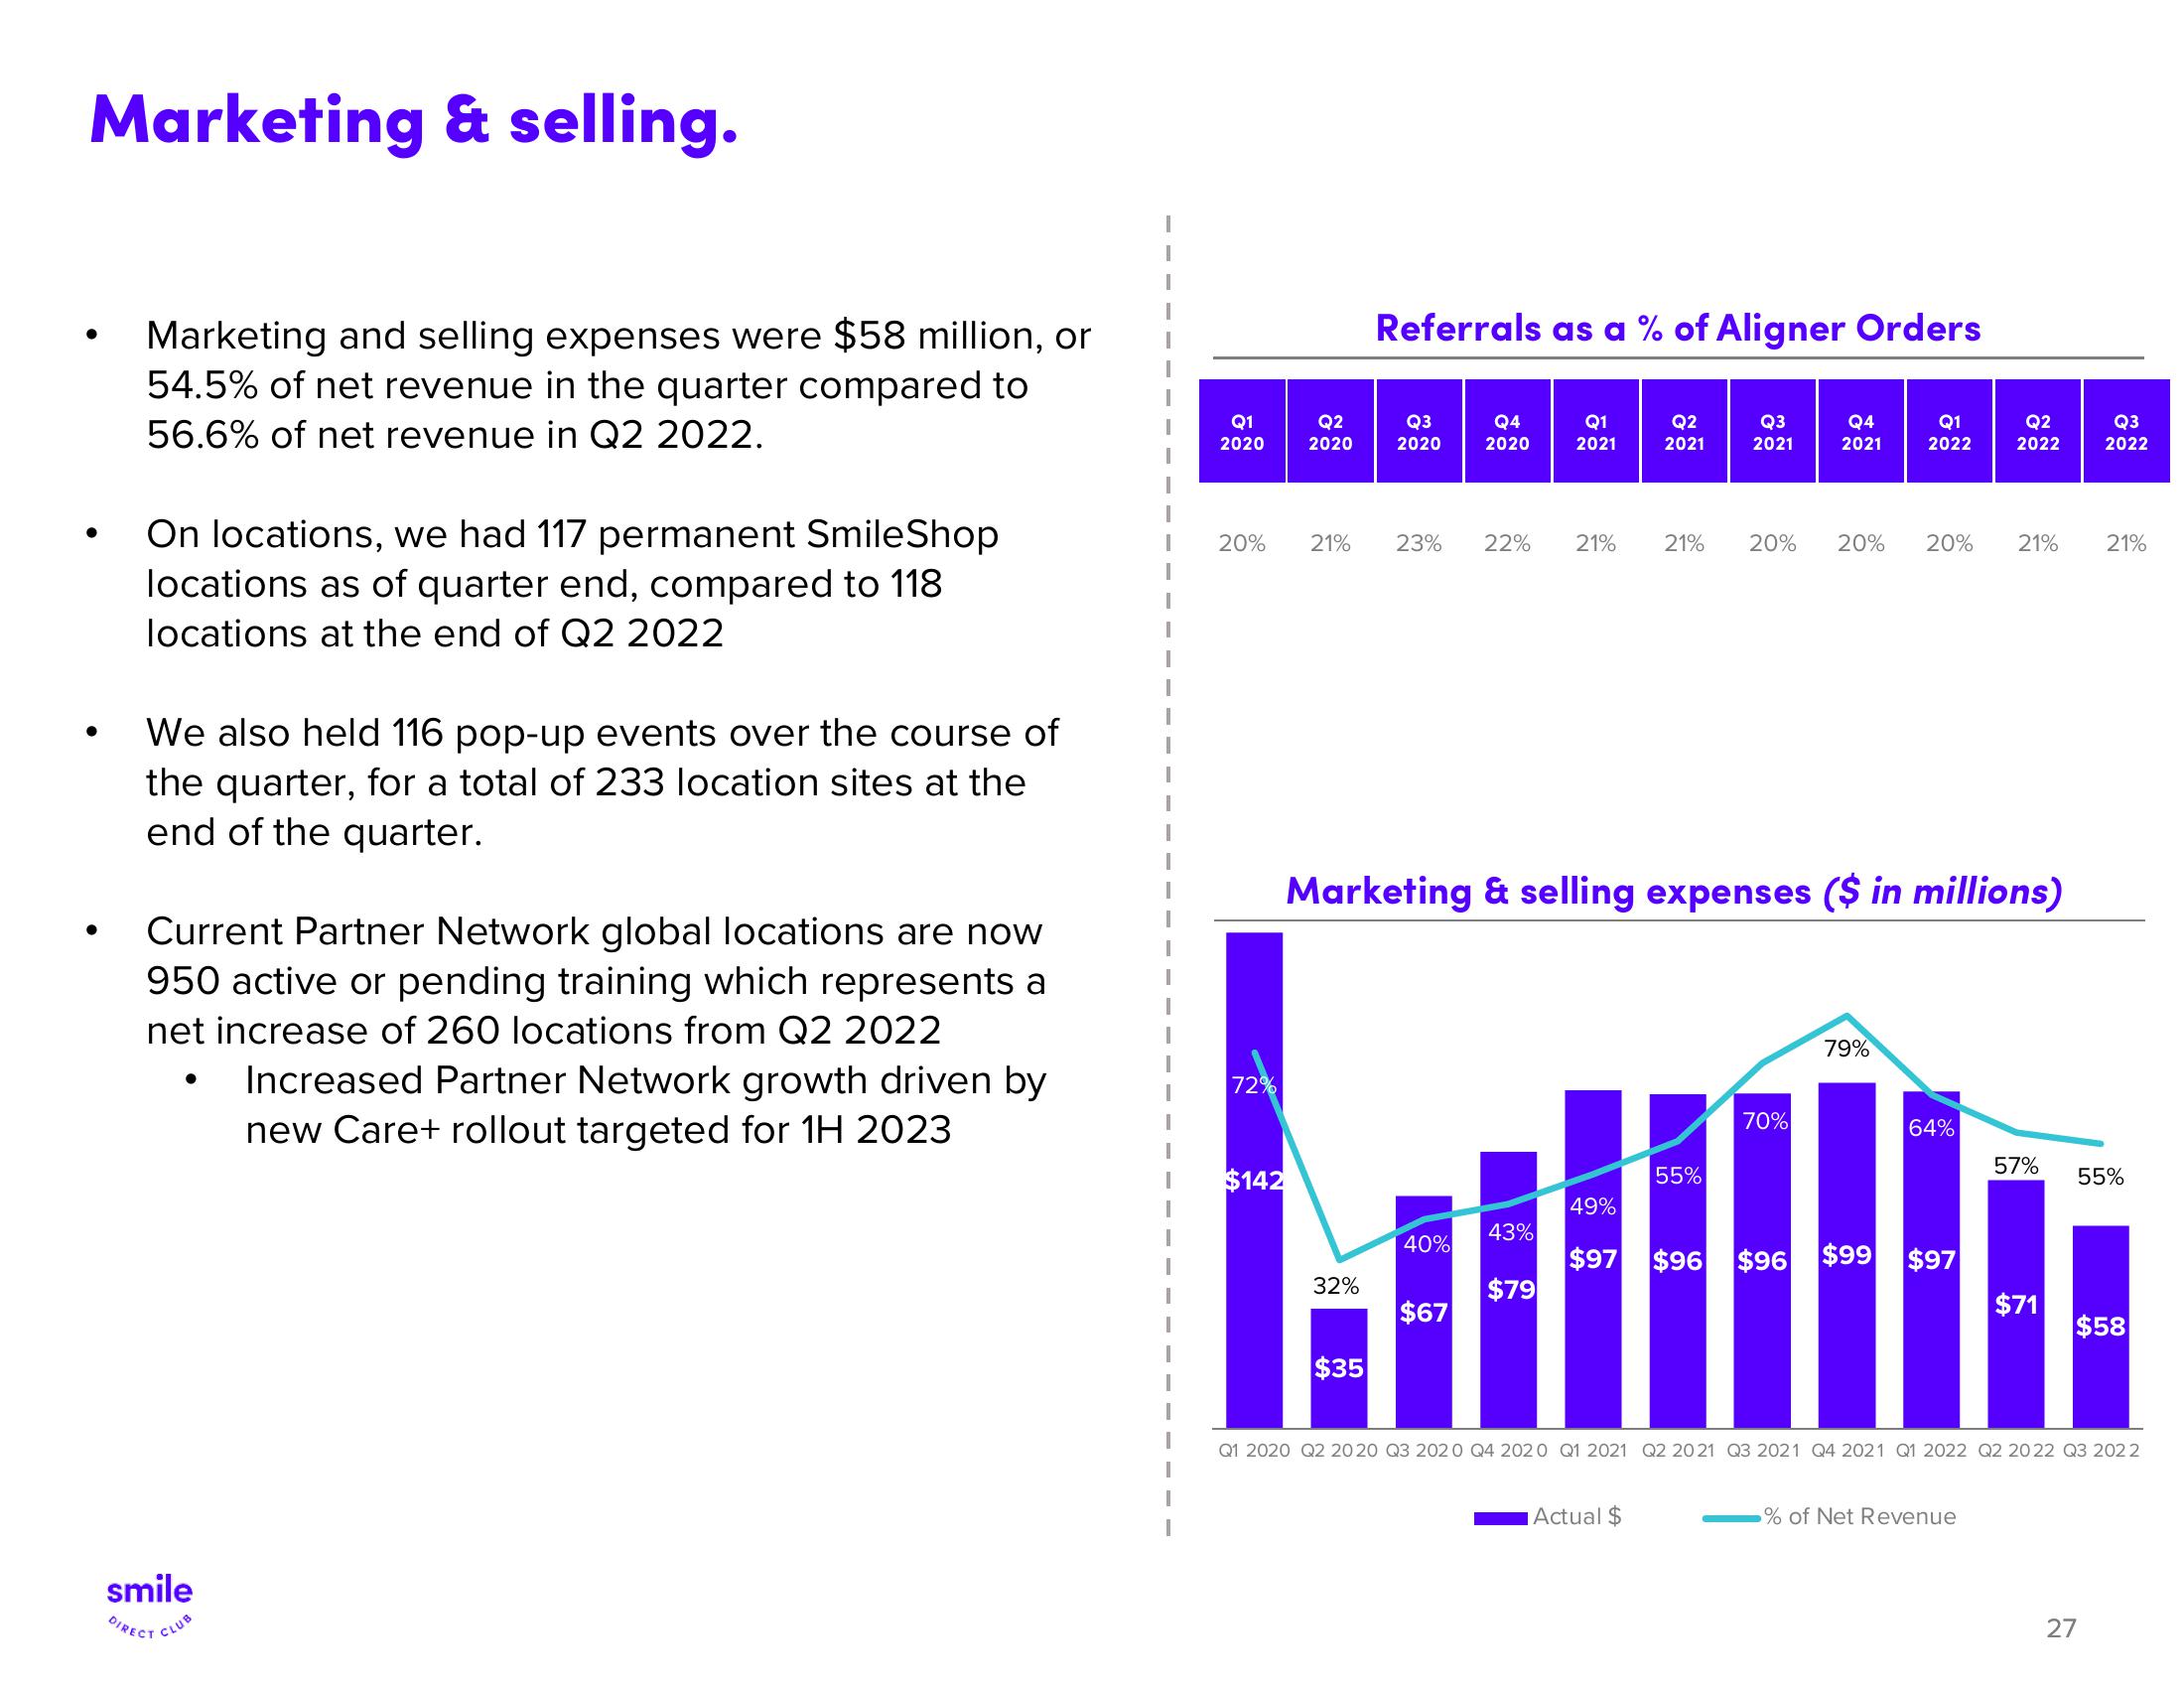
Marketing and selling expenses were $58 million, or
54.5% of net revenue in the quarter compared to
56.6% of net revenue in Q2 2022.
On locations, we had 117 permanent SmileShop
locations as of quarter end, compared to 118
locations at the end of Q2 2022
We also held 116 pop-up events over the course of
the quarter, for a total of 233 location sites at the
end of the quarter.
Current Partner Network global locations are now
950 active or pending training which represents a
net increase of 260 locations from Q2 2022
smile
DIRECT
CLUB
Increased Partner Network growth driven by
new Care+ rollout targeted for 1H 2023
Q1
2020
20% 21%
72%
Q2
2020
$142
32%
Referrals as a % of Aligner Orders
Q1
2021
Q2
2021
Q3
2021
$35
Q3
2020
23% 22% 21%
Q4
2020
40%
$67
43%
Marketing & selling expenses ($ in millions)
$79
21% 20% 20%
Q4
2021
55%
Actual $
70%
Q1
2022
79%
20%
64%
49%
$97 $96 $96 $99 $97
Q2
2022
21%
% of Net Revenuel
57%
$71
Q3
2022
21%
55%
Q1 2020 Q2 2020 Q3 2020 Q4 2020 Q1 2021 Q2 20 21 Q3 2021 Q4 2021 Q1 2022 Q2 2022 Q3 202 2
$58
27View entire presentation