OppFi Results Presentation Deck
2Q21 Financial Results
($ in 000s)
Total Revenue
Adj. Revenue ¹
Net Income
Adj. Net Income ¹
Adj. Net Income Margin
Adj. EBITDA¹
Adj. EBITDA Margin
22
Unaudited
Three Months Ended
6/30/2020
6/30/2021
$78,376
$78,376
$17,987
$17,858
22.8%
$32,324
41.2%
$61,281
$73,611
$25,119
$1,586
2.2%
$9,101
12.4%
YoY%
27.9%
6.5%
(28.4%)
1,025.9%
2,060bps
255.2%
2,880bps
Key Highlights
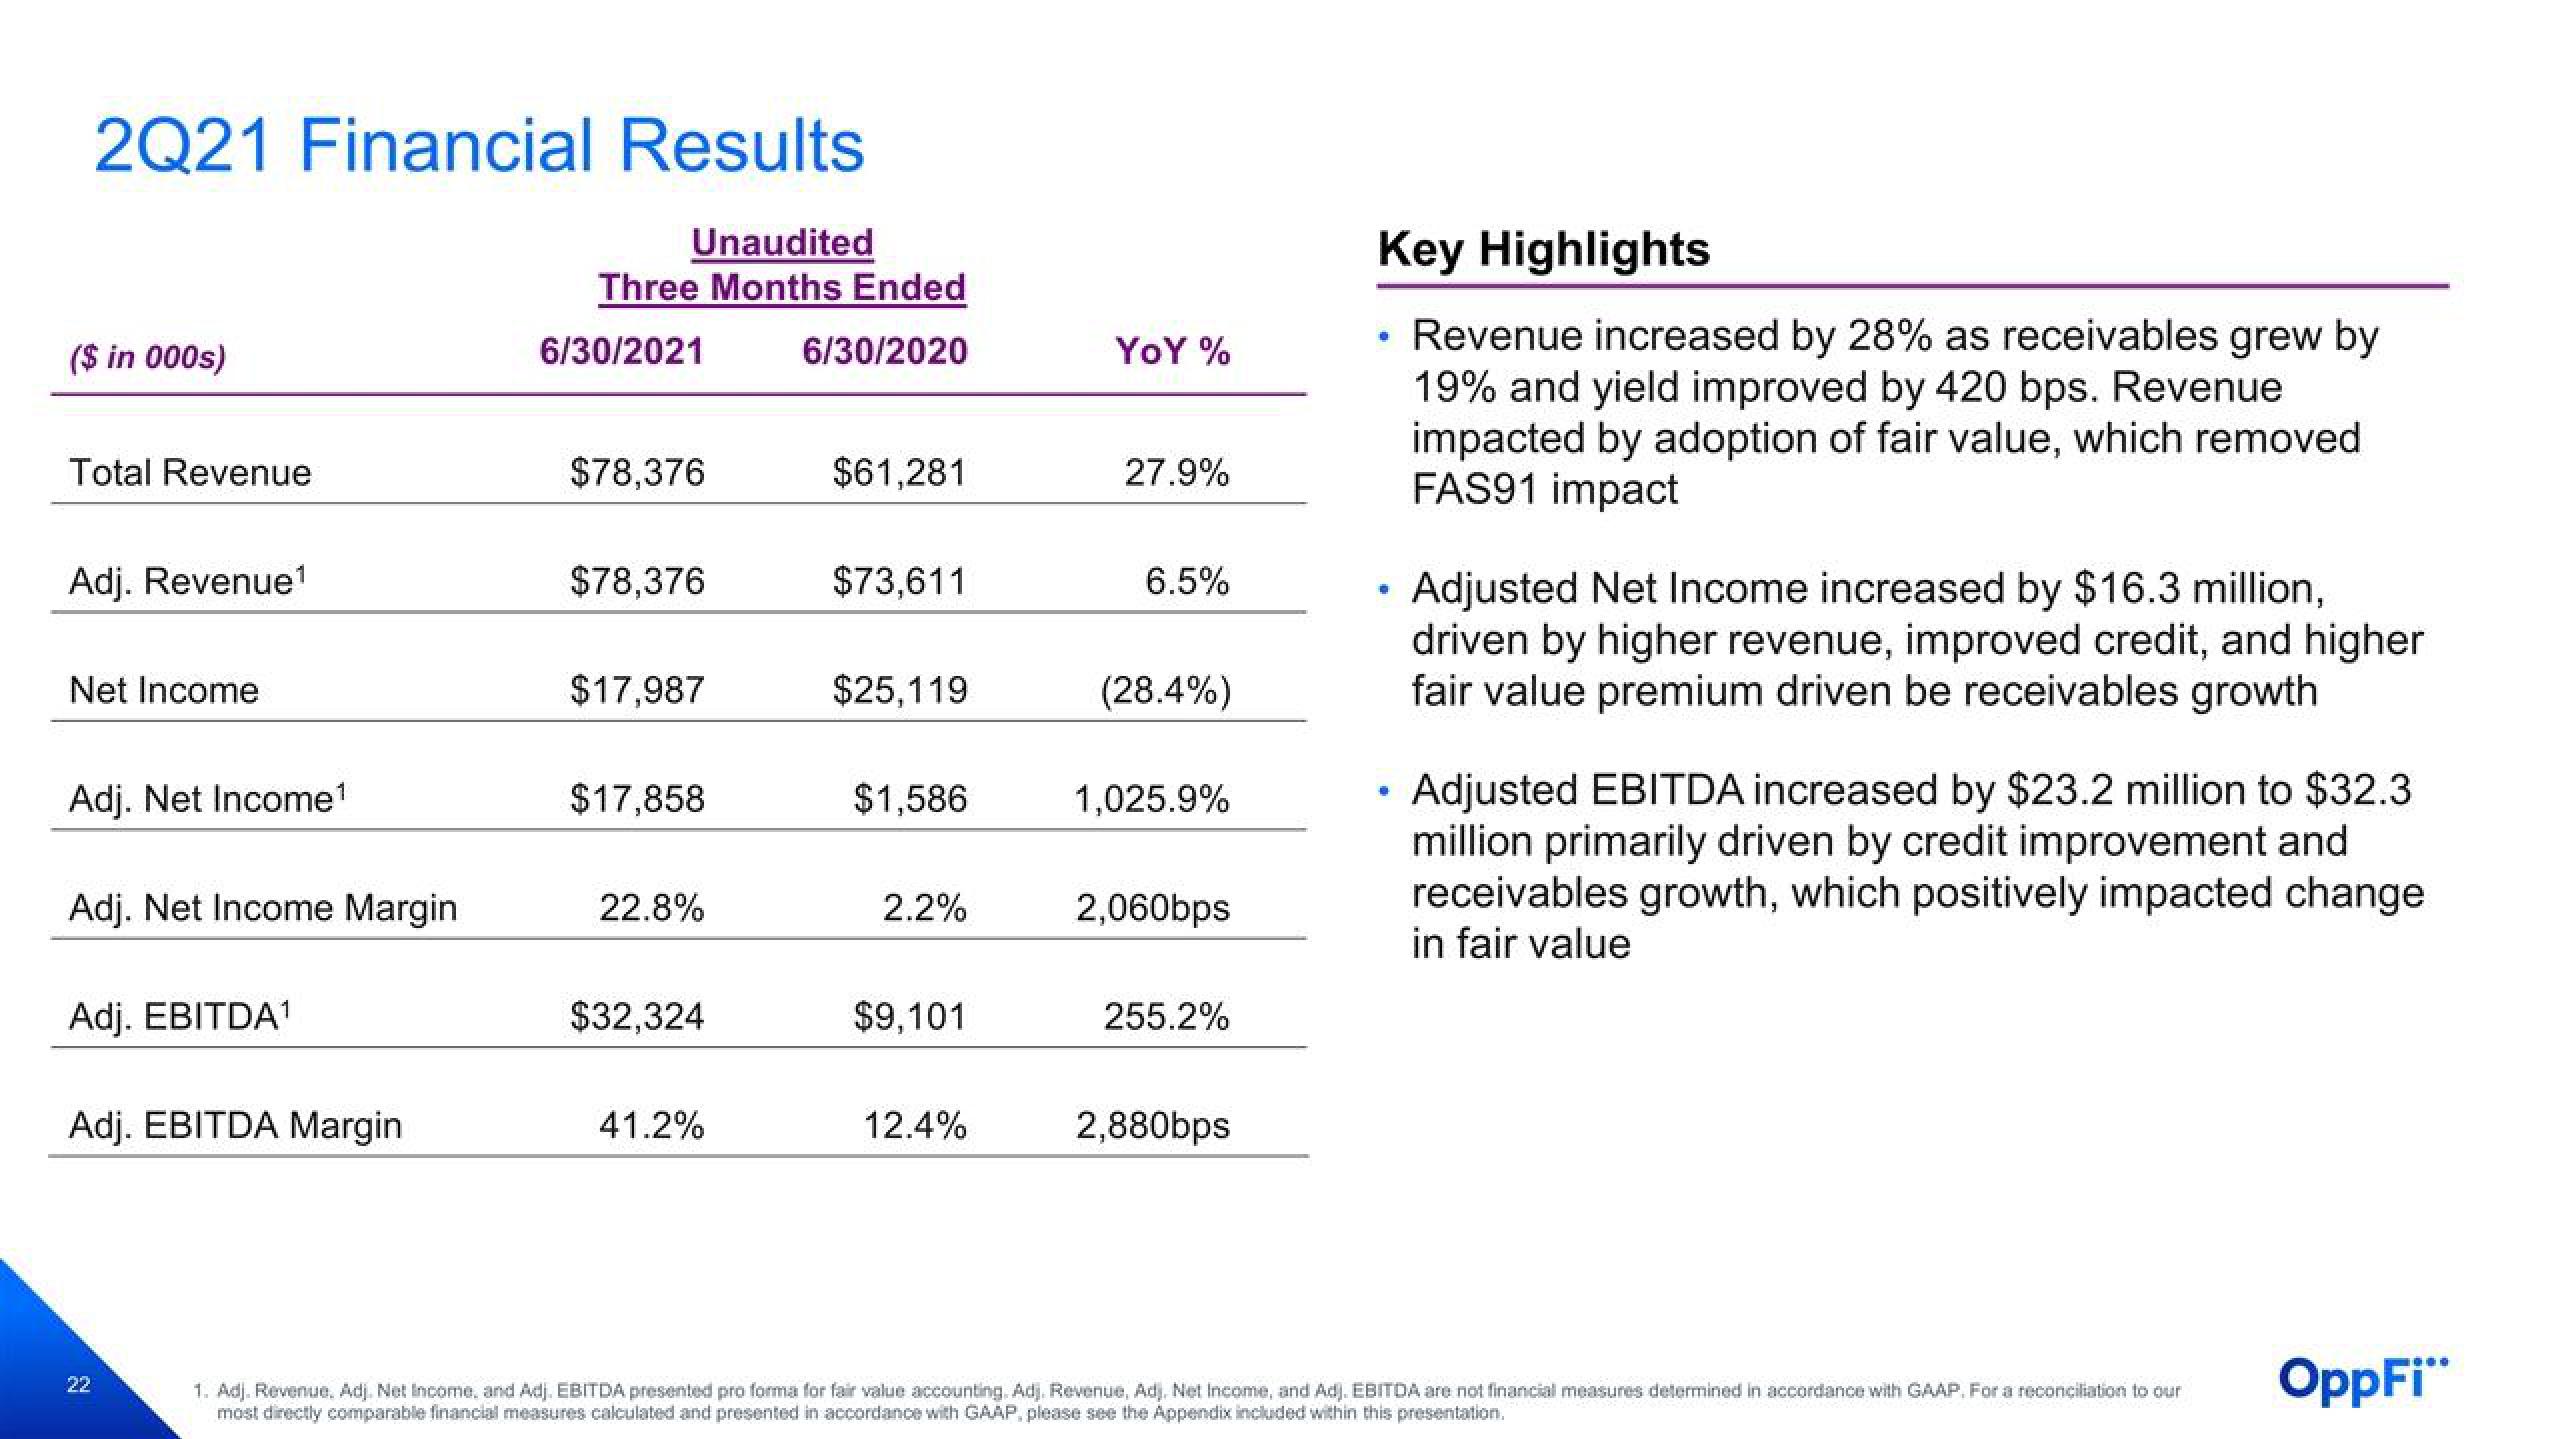
Revenue increased by 28% as receivables grew by
19% and yield improved by 420 bps. Revenue
impacted by adoption of fair value, which removed
FAS91 impact
C
●
Adjusted Net Income increased by $16.3 million,
driven by higher revenue, improved credit, and higher
fair value premium driven be receivables growth
Adjusted EBITDA increased by $23.2 million to $32.3
million primarily driven by credit improvement and
receivables growth, which positively impacted change
in fair value
1. Adj. Revenue. Adj. Net Income, and Adj. EBITDA presented pro forma for fair value accounting. Adj. Revenue, Adj. Net Income, and Adj. EBITDA are not financial measures determined in accordance with GAAP. For a reconciliation to our
most directly comparable financial measures calculated and presented in accordance with GAAP, please see the Appendix included within this presentation.
OppFi"View entire presentation