J.P. Morgan 2016 Auto Conference
FY 2016 Performance Update
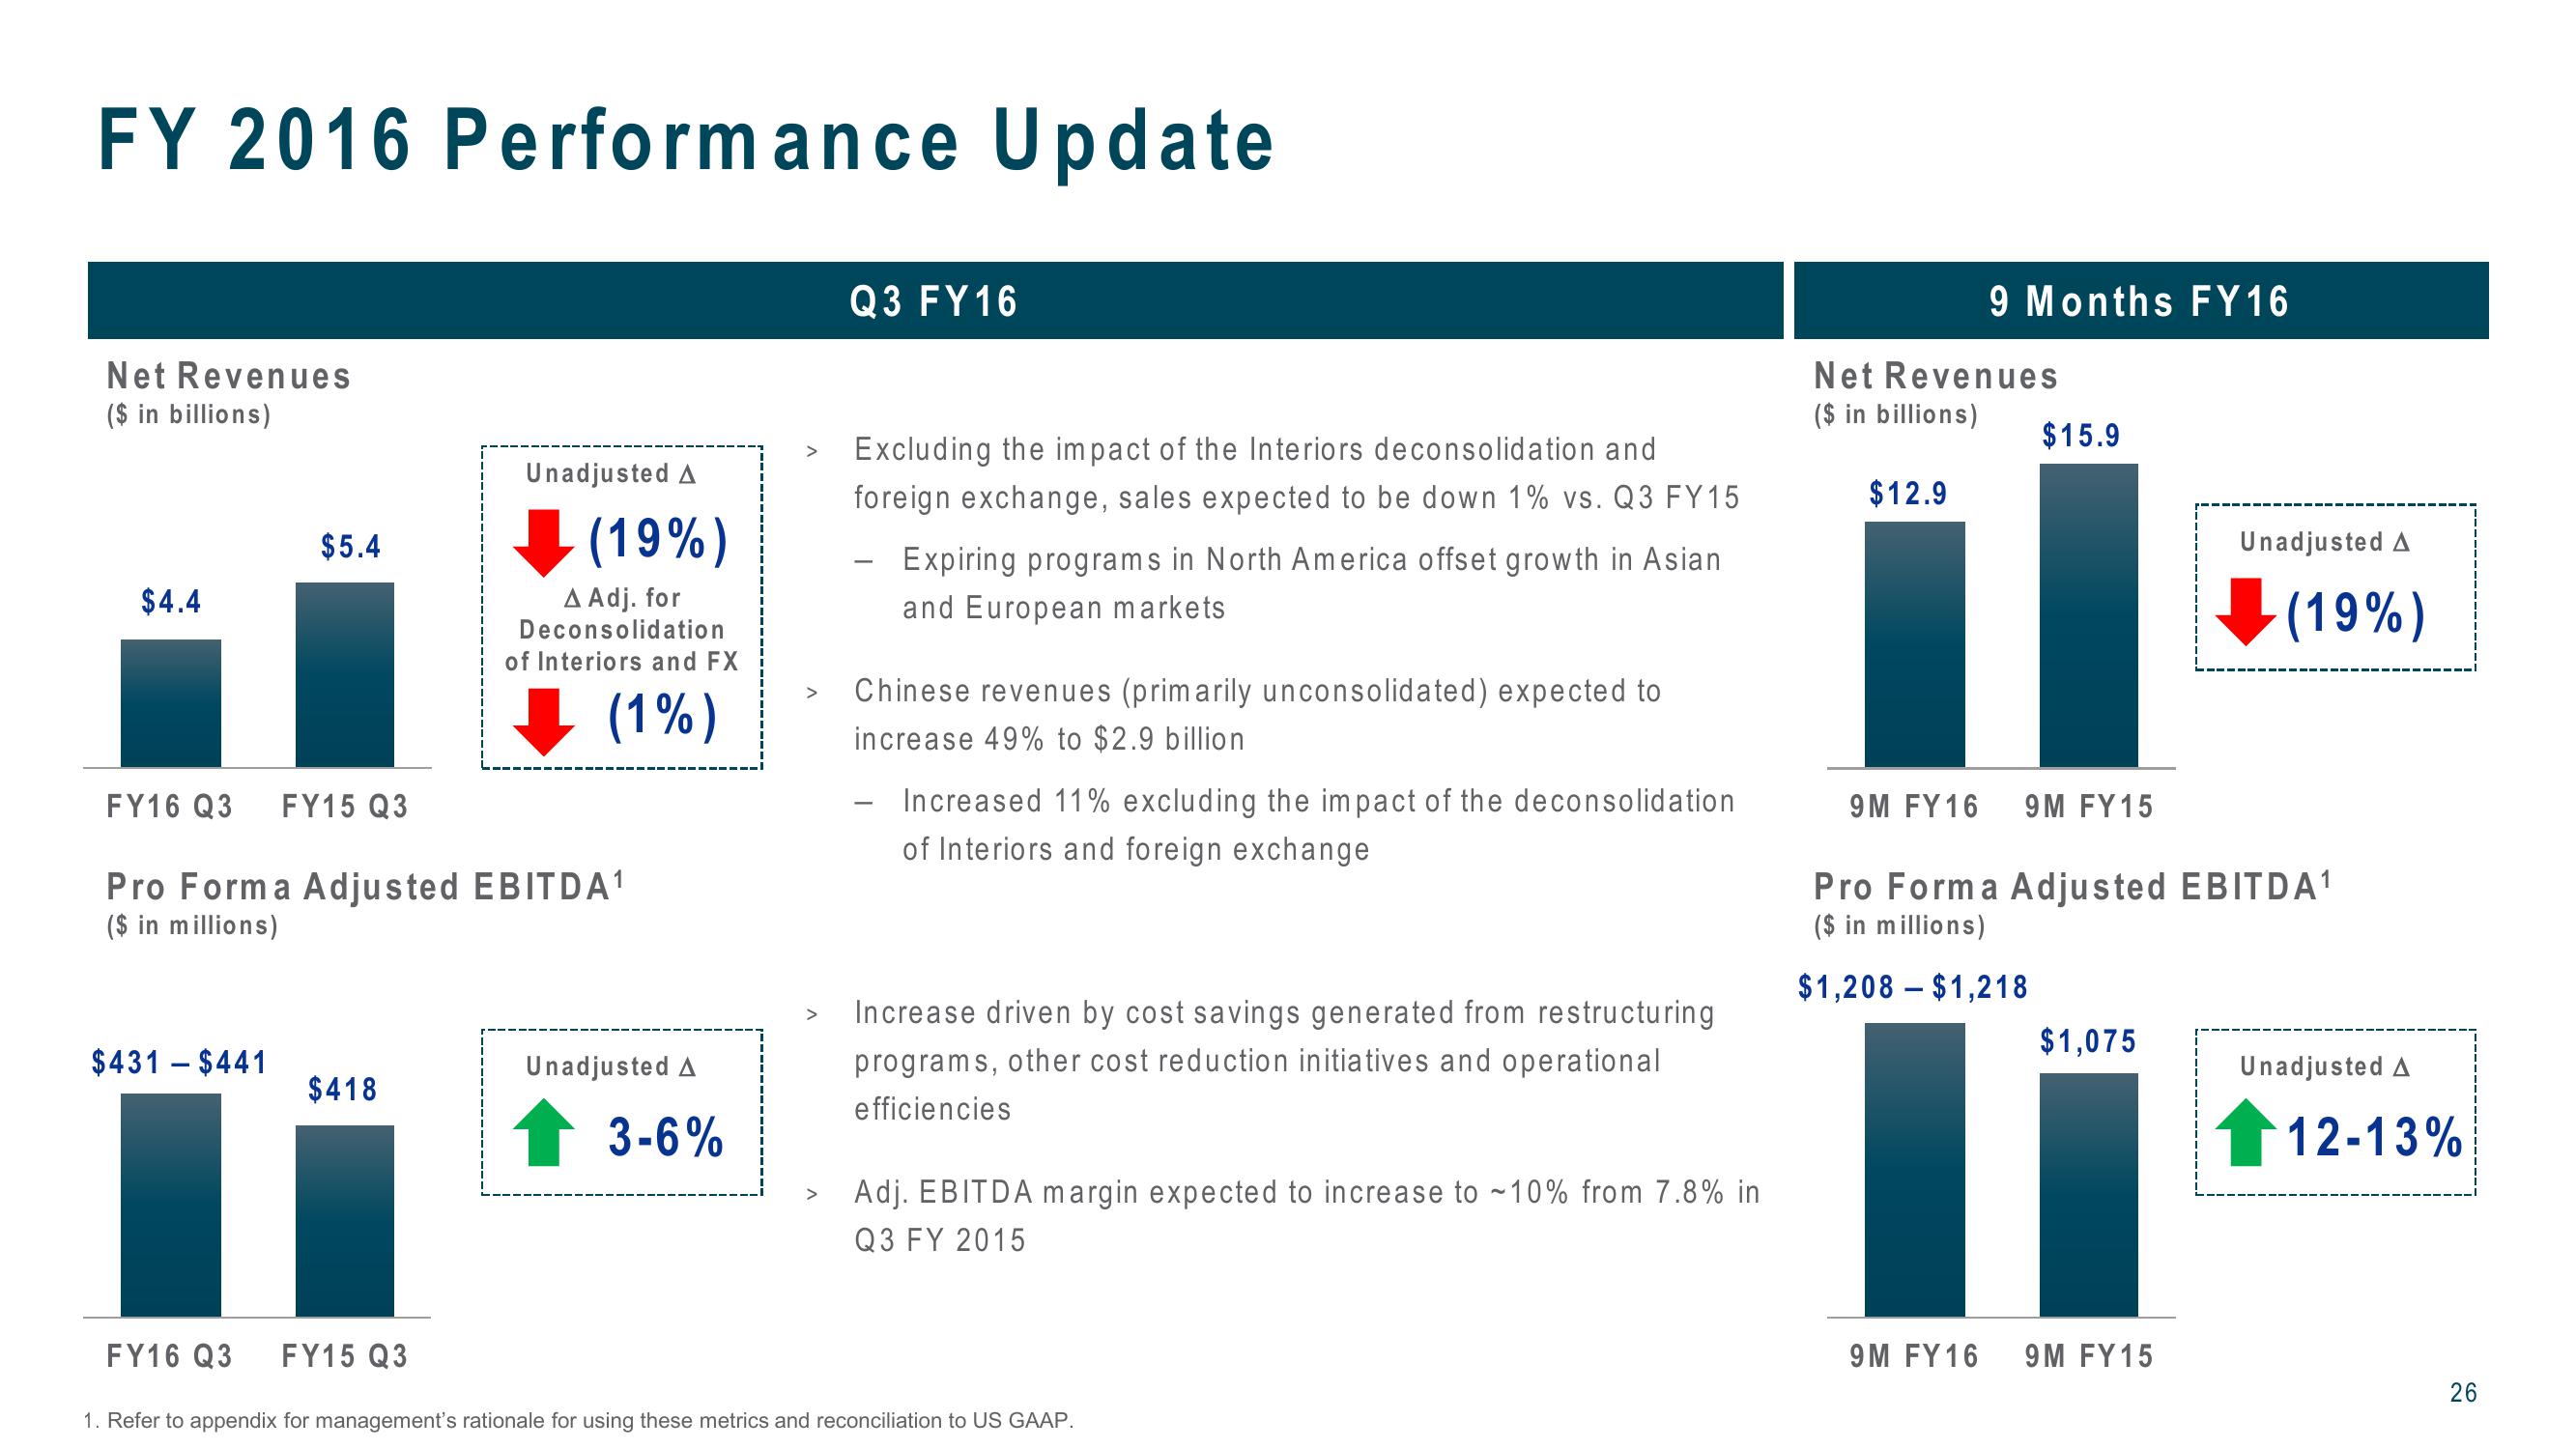
Net Revenues
($ in billions)
$4.4
$5.4
>
Unadjusted A
(19%)
▲ Adj. for
Deconsolidation
of Interiors and FX
(1%)
FY16 Q3 FY15 Q3
Pro Forma Adjusted EBITDA¹
($ in millions)
$431 - $441
Unadjusted A
$418
3-6%
>
>
Q3 FY 16
Excluding the impact of the Interiors deconsolidation and
foreign exchange, sales expected to be down 1% vs. Q3 FY15
- Expiring programs in North America offset growth in Asian
and European markets
Chinese revenues (primarily unconsolidated) expected to
increase 49% to $2.9 billion
Increased 11% excluding the impact of the deconsolidation
of Interiors and foreign exchange
Increase driven by cost savings generated from restructuring
programs, other cost reduction initiatives and operational
efficiencies
9 Months FY16
Net Revenues
($ in billions)
$12.9
$15.9
9M FY 16 9M FY15
Unadjusted A
(19%)
Pro Forma Adjusted EBITDA1
($ in millions)
$1,208 $1,218
$1,075
Unadjusted A
12-13%
FY16 Q3
FY15 Q3
>
Adj. EBITDA margin expected to increase to -10% from 7.8% in
Q3 FY 2015
1. Refer to appendix for management's rationale for using these metrics and reconciliation to US GAAP.
9M FY 16
9M FY15
26View entire presentation