Melrose Results Presentation Deck
Structurally growing market
■
Flight hours returning strongly
Million
250
200
150
100
50
0
2018
2019
Source: Cirium
2020
Melrose
2021
23-25
CAGR: 10%
2022
2023
2024
2025
2026
2027
Narrowbody ■Widebody
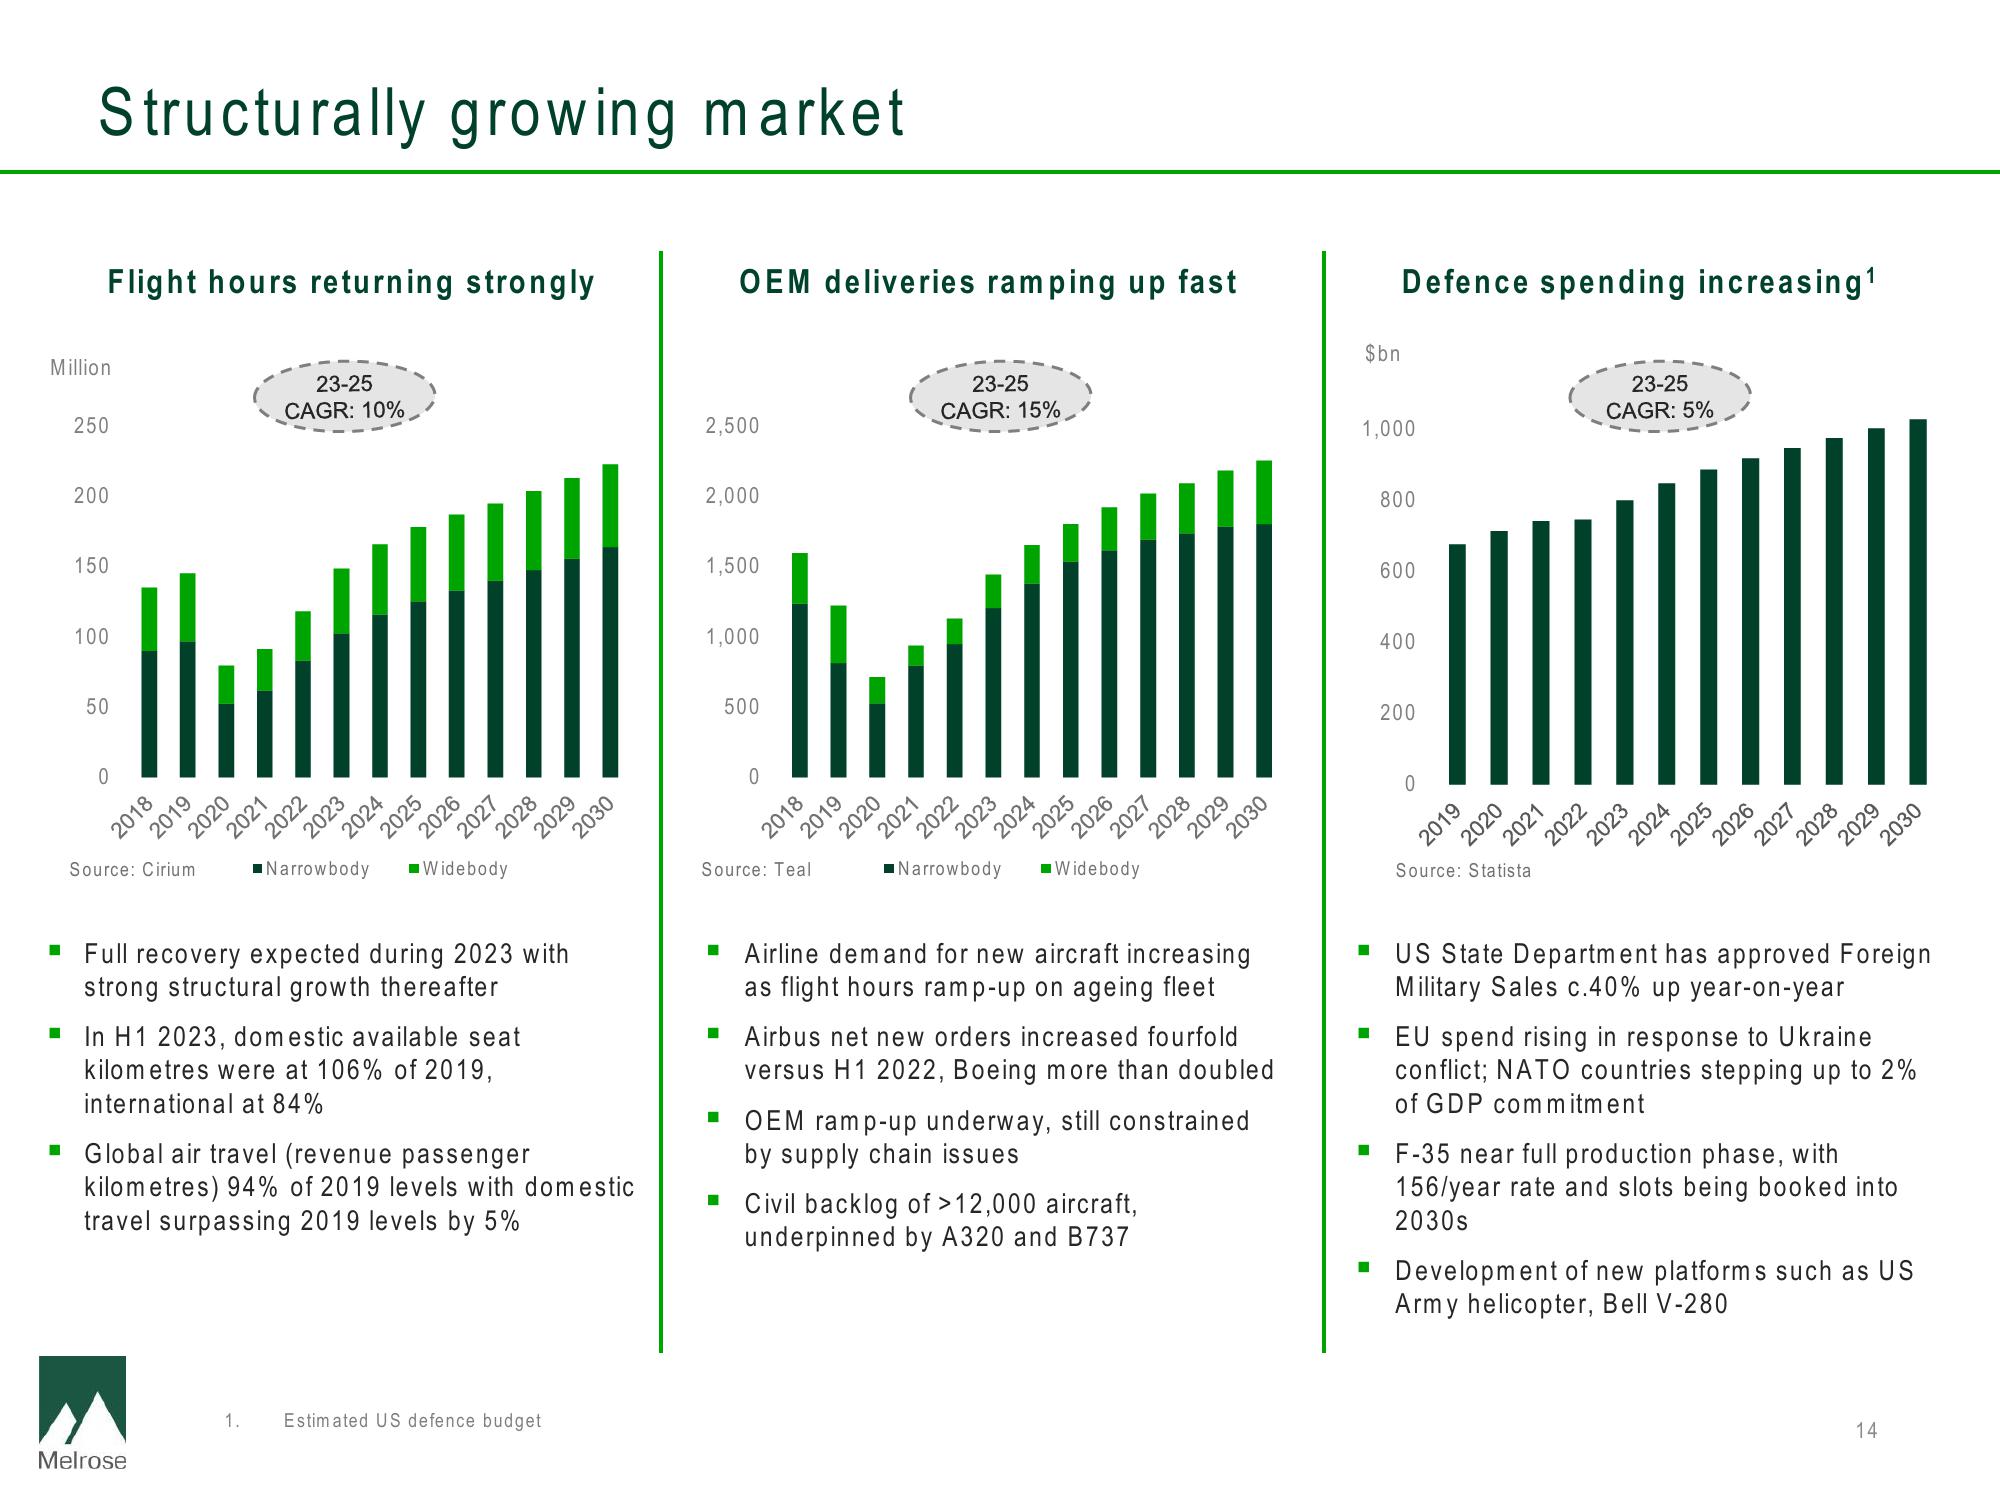
In H1 2023, domestic available seat
kilometres were at 106% of 2019,
international at 84%
2028
Full recovery expected during 2023 with
strong structural growth thereafter
2029
■ Global air travel (revenue passenger
kilometres) 94% of 2019 levels with domestic
travel surpassing 2019 levels by 5%
1. Estimated US defence budget
2030
2,500
OEM deliveries ramping up fast
2,000
1,500
1,000
■
■
500
0
Source: Teal
bol
2018
23-25
CAGR: 15%
2019
2020
2021
2022
2023
Narrowbody
2024
2025
2026
■Widebody
2027
2028
■ Civil backlog of >12,000 aircraft,
underpinned by A320 and B737
2029
Airline demand for new aircraft increasing
as flight hours ramp-up on ageing fleet
Airbus net new orders increased fourfold
versus H1 2022, Boeing more than doubled
OEM ramp-up underway, still constrained
by supply chain issues
2030
$bn
Defence spending increasing¹
1,000
■
■
800
600
400
200
0
2019
2020
2021
Source: Statista
2022
23-25
CAGR: 5%
2023
2024
2025
2026
2027
2028
2029
■ US State Department has approved Foreign
Military Sales c.40% up year-on-year
2030
EU spend rising in response to Ukraine
conflict; NATO countries stepping up to 2%
of GDP commitment
F-35 near full production phase, with
156/year rate and slots being booked into
2030s
▪ Development of new platforms such as US
Army helicopter, Bell V-280
14View entire presentation