Inovalon Results Presentation Deck
Q4 2017 - Revenue Growth and Margin
Expansion
Growth
Revenue
Continued
Investment
$96.1
Q4 2016 Q4 2017
Operating 59.8%
Leverage
Gross Margin
Q4 2016
$114.6
$7.4
Q4 2016
67.6%
Sales & Marketing
$9.7
Q4 2017
Q4 2017
Adjusted EBITDA
$25.5
$14.3
Q4 2016
Adj. EBITDA Margin
22.3%
14.9%
Q4 2016
$21.1
Q4 2017
Investment in Innovation
$26.4
Q4 2016
Note: All $ amounts are in Millions except as otherwise noted.
1: Gross Margin defined as Revenue less Cost of Revenue, as a percentage of Revenue.
2: Adj. EBITDA Margin represents Adjusted EBITDA as a percentage of Revenue.
INOV Q4 2017 Earnings Presentation Supplement (2.20.18) v1.0.0
Q4 2017
Q4 2017
4
#
·
#
@
inovalon
Ramping of the Inovalon ONE™ Platform
engagements with four national health plans,
in addition to other new business signings
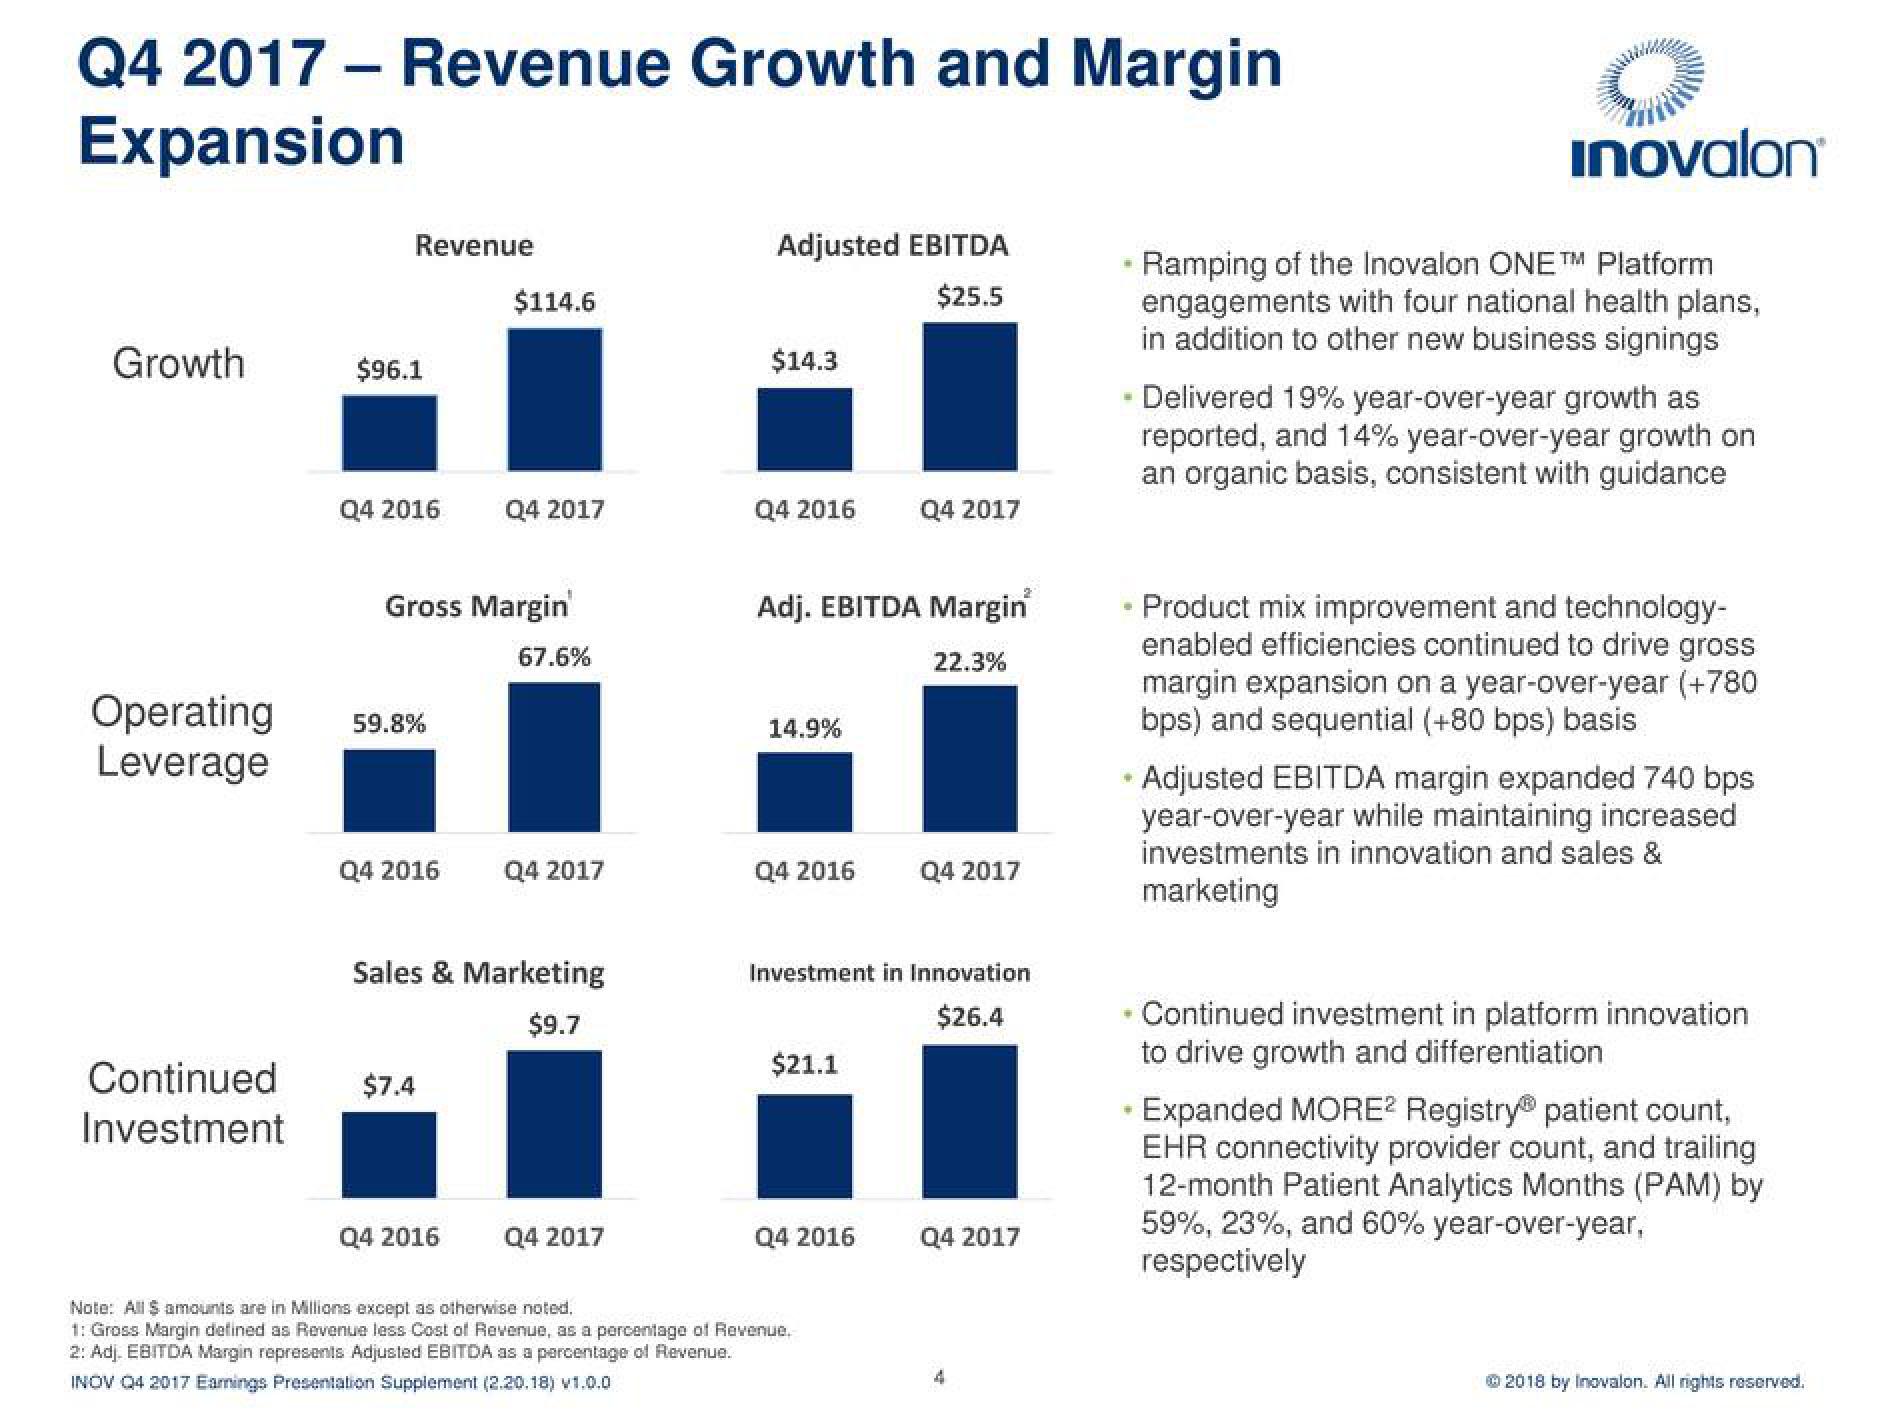
Delivered 19% year-over-year growth as
reported, and 14% year-over-year growth on
an organic basis, consistent with guidance
Product mix improvement and technology-
enabled efficiencies continued to drive gross
margin expansion on a year-over-year (+780
bps) and sequential (+80 bps) basis
Adjusted EBITDA margin expanded 740 bps
year-over-year while maintaining increased
investments in innovation and sales &
marketing
Continued investment in platform innovation
to drive growth and differentiation
Expanded MORE2 Registry patient count,
EHR connectivity provider count, and trailing
12-month Patient Analytics Months (PAM) by
59%, 23%, and 60% year-over-year,
respectively
Ⓒ2018 by Inovalon. All rights reserved.View entire presentation