Twin Vee PowerCats FWP Presentation Deck
TWIN VEE
POWERCATS CO.
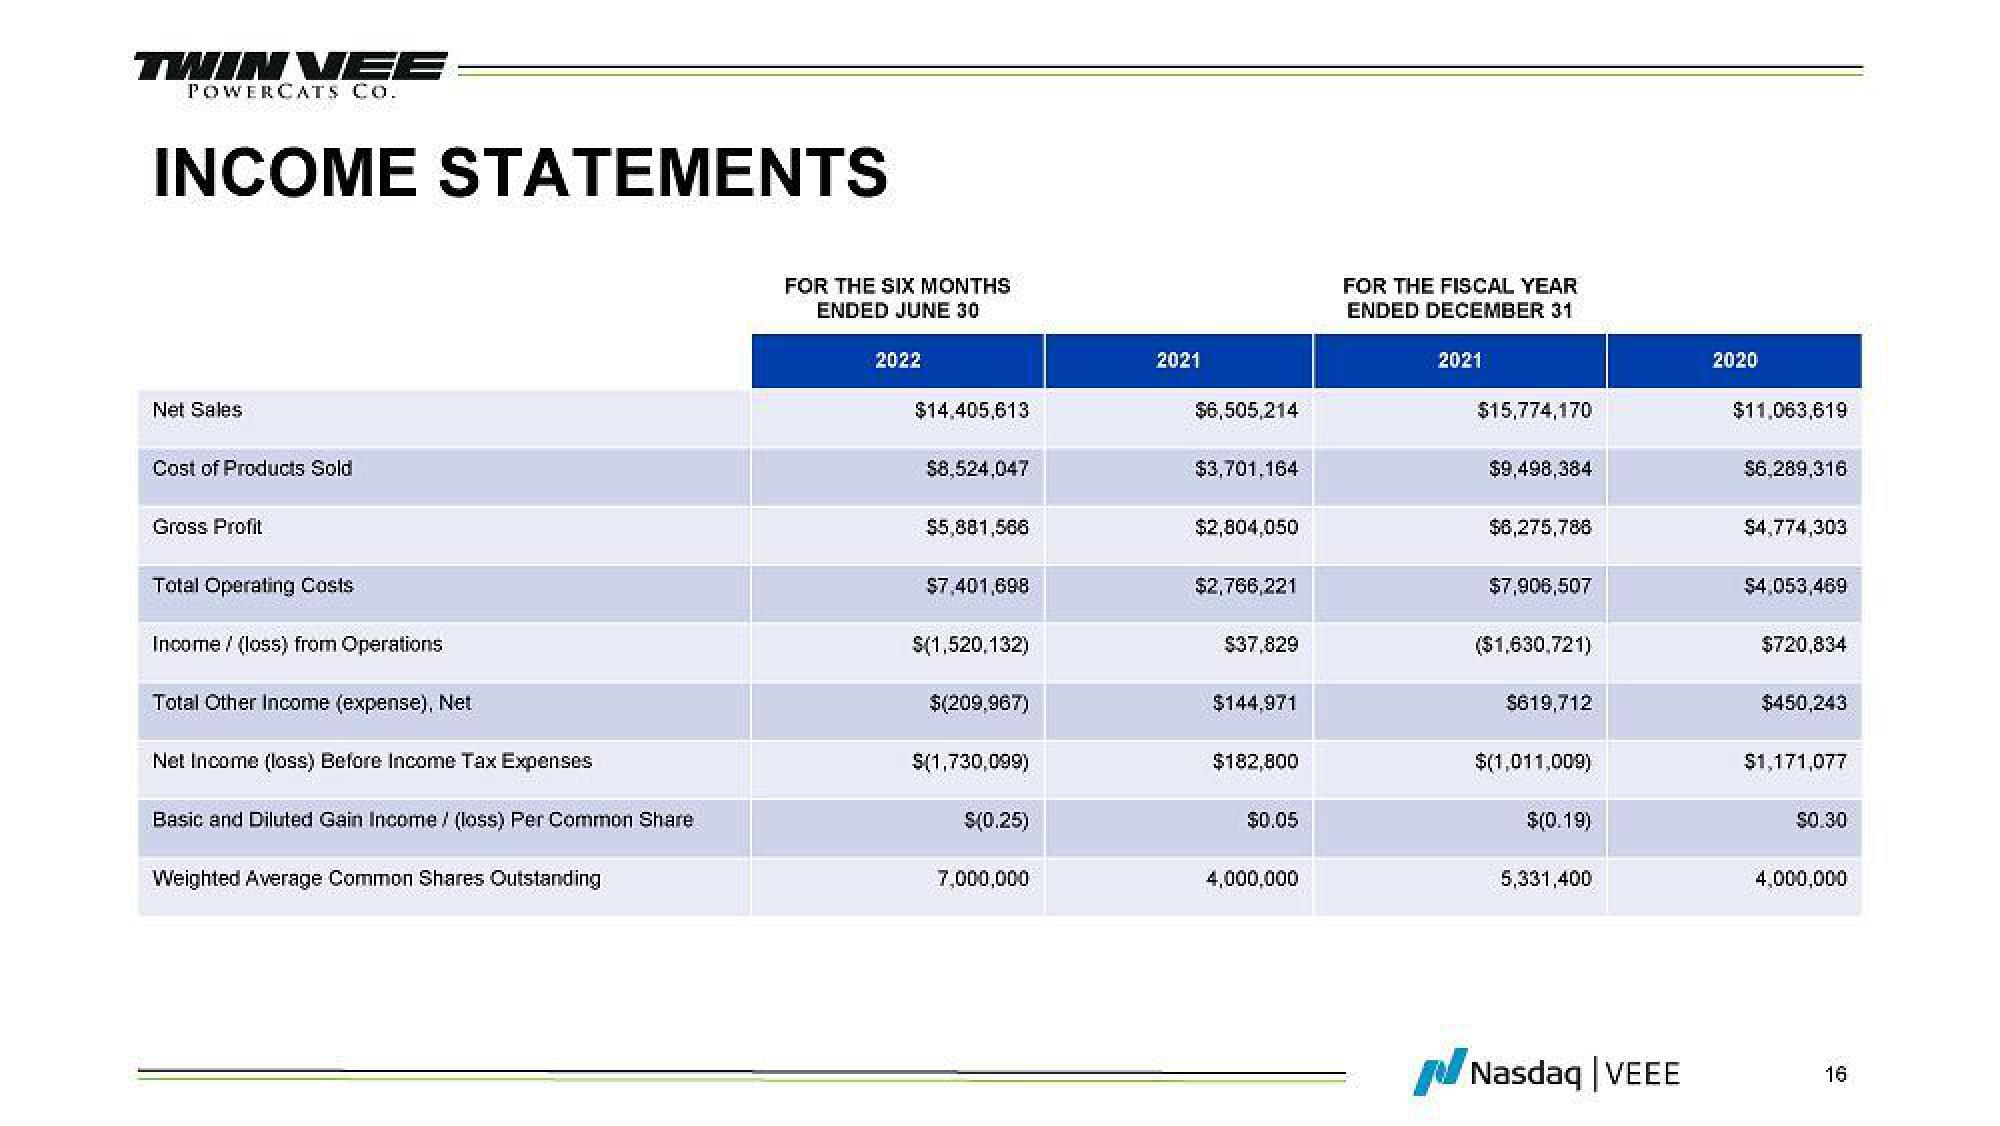
INCOME STATEMENTS
Net Sales
Cost of Products Sold
Gross Profit
Total Operating Costs
Income / (loss) from Operations
Total Other Income (expense), Net
Net Income (loss) Before Income Tax Expenses
Basic and Diluted Gain Income (loss) Per Common Share
Weighted Average Common Shares Outstanding
FOR THE SIX MONTHS
ENDED JUNE 30
2022
$14.405,613
$8,524,047
$5,881,566
$7,401,698
$(1,520,132)
$(209,967)
$(1,730,099)
$(0.25)
7,000,000
2021
$6,505,214
$3,701,164
$2,804,050
$2,766,221
$37,829
$144.971
$182,800
$0.05
4,000,000
FOR THE FISCAL YEAR
ENDED DECEMBER 31
2021
$15,774,170
$9,498,384
$6,275,786
$7,906,507
($1,630,721)
$619,712
$(1,011,009)
$(0.19)
5,331,400
Nasdaq | VEEE
2020
$11,063,619
$6,289,316
$4,774,303
$4,053,469
$720,834
$450,243
$1,171,077
POR
$0.30
4,000,000
16View entire presentation