TPG Results Presentation Deck
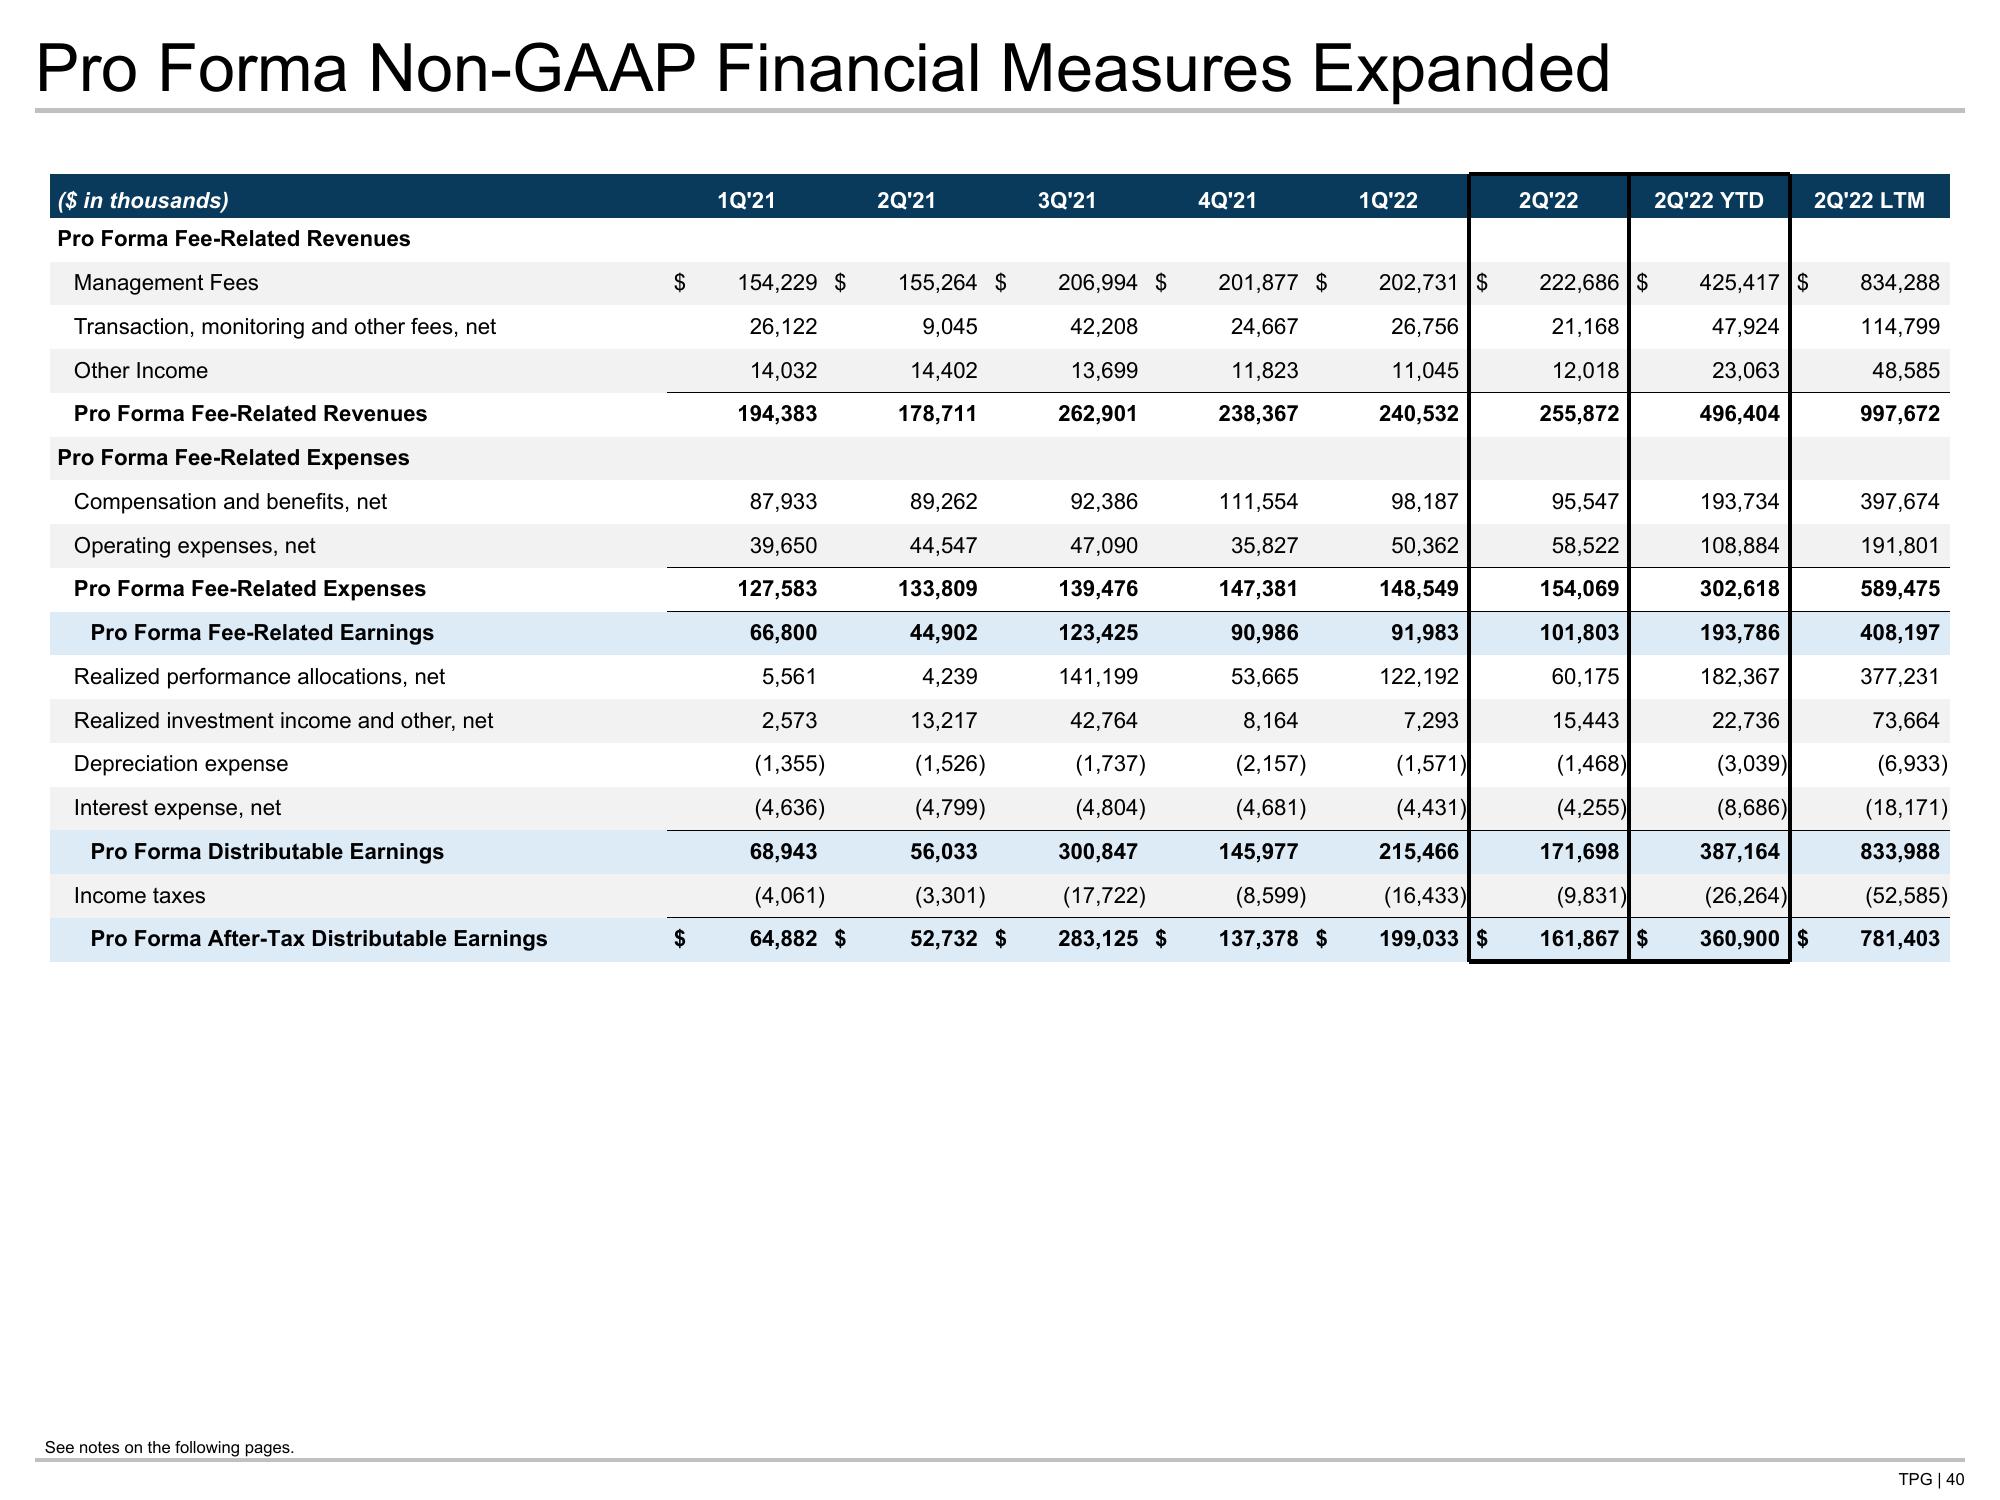
Pro Forma Non-GAAP Financial Measures Expanded
($ in thousands)
Pro Forma Fee-Related Revenues
Management Fees
Transaction, monitoring and other fees, net
Other Income
Pro Forma Fee-Related Revenues
Pro Forma Fee-Related Expenses
Compensation and benefits, net
Operating expenses, net
Pro Forma Fee-Related Expenses
Pro Forma Fee-Related Earnings
Realized performance allocations, net
Realized investment income and other, net
Depreciation expense
Interest expense, net
Pro Forma Distributable Earnings
Income taxes
Pro Forma After-Tax Distributable Earnings
See notes on the following pages.
$
$
1Q'21
2Q'21
87,933
39,650
127,583
66,800
5,561
2,573
(1,355)
(4,636)
68,943
(4,061)
64,882 $
3Q'21
89,262
44,547
133,809
44,902
4,239
13,217
(1,526)
(4,799)
56,033
(3,301)
52,732 $
4Q'21
92,386
47,090
139,476
123,425
141,199
42,764
(1,737)
(4,804)
300,847
(17,722)
283,125 $
154,229 $ 155,264 $ 206,994 $ 201,877 $ 202,731 $ 222,686 $ 425,417 $
26,122
9,045
42,208
24,667
26,756
21,168
47,924
14,032
14,402
13,699
11,823
11,045
12,018
23,063
194,383
178,711
262,901
238,367
240,532
255,872
496,404
111,554
35,827
147,381
90,986
53,665
8,164
(2,157)
(4,681)
1Q'22
145,977
(8,599)
137,378 $
98,187
50,362
148,549
91,983
122,192
2Q'22
7,293
(1,571)
(4,431)
95,547
58,522
154,069
101,803
60,175
15,443
(1,468)
(4,255)
171,698
2Q'22 YTD
215,466
(16,433)
(9,831)
199,033 $ 161,867 $
193,734
108,884
302,618
193,786
182,367
22,736
(3,039)
(8,686)
387,164
(26,264)
360,900 $
2Q'22 LTM
834,288
114,799
48,585
997,672
397,674
191,801
589,475
408,197
377,231
73,664
(6,933)
(18,171)
833,988
(52,585)
781,403
TPG | 40View entire presentation