Stem SPAC Presentation Deck
stem Revenue Diversity
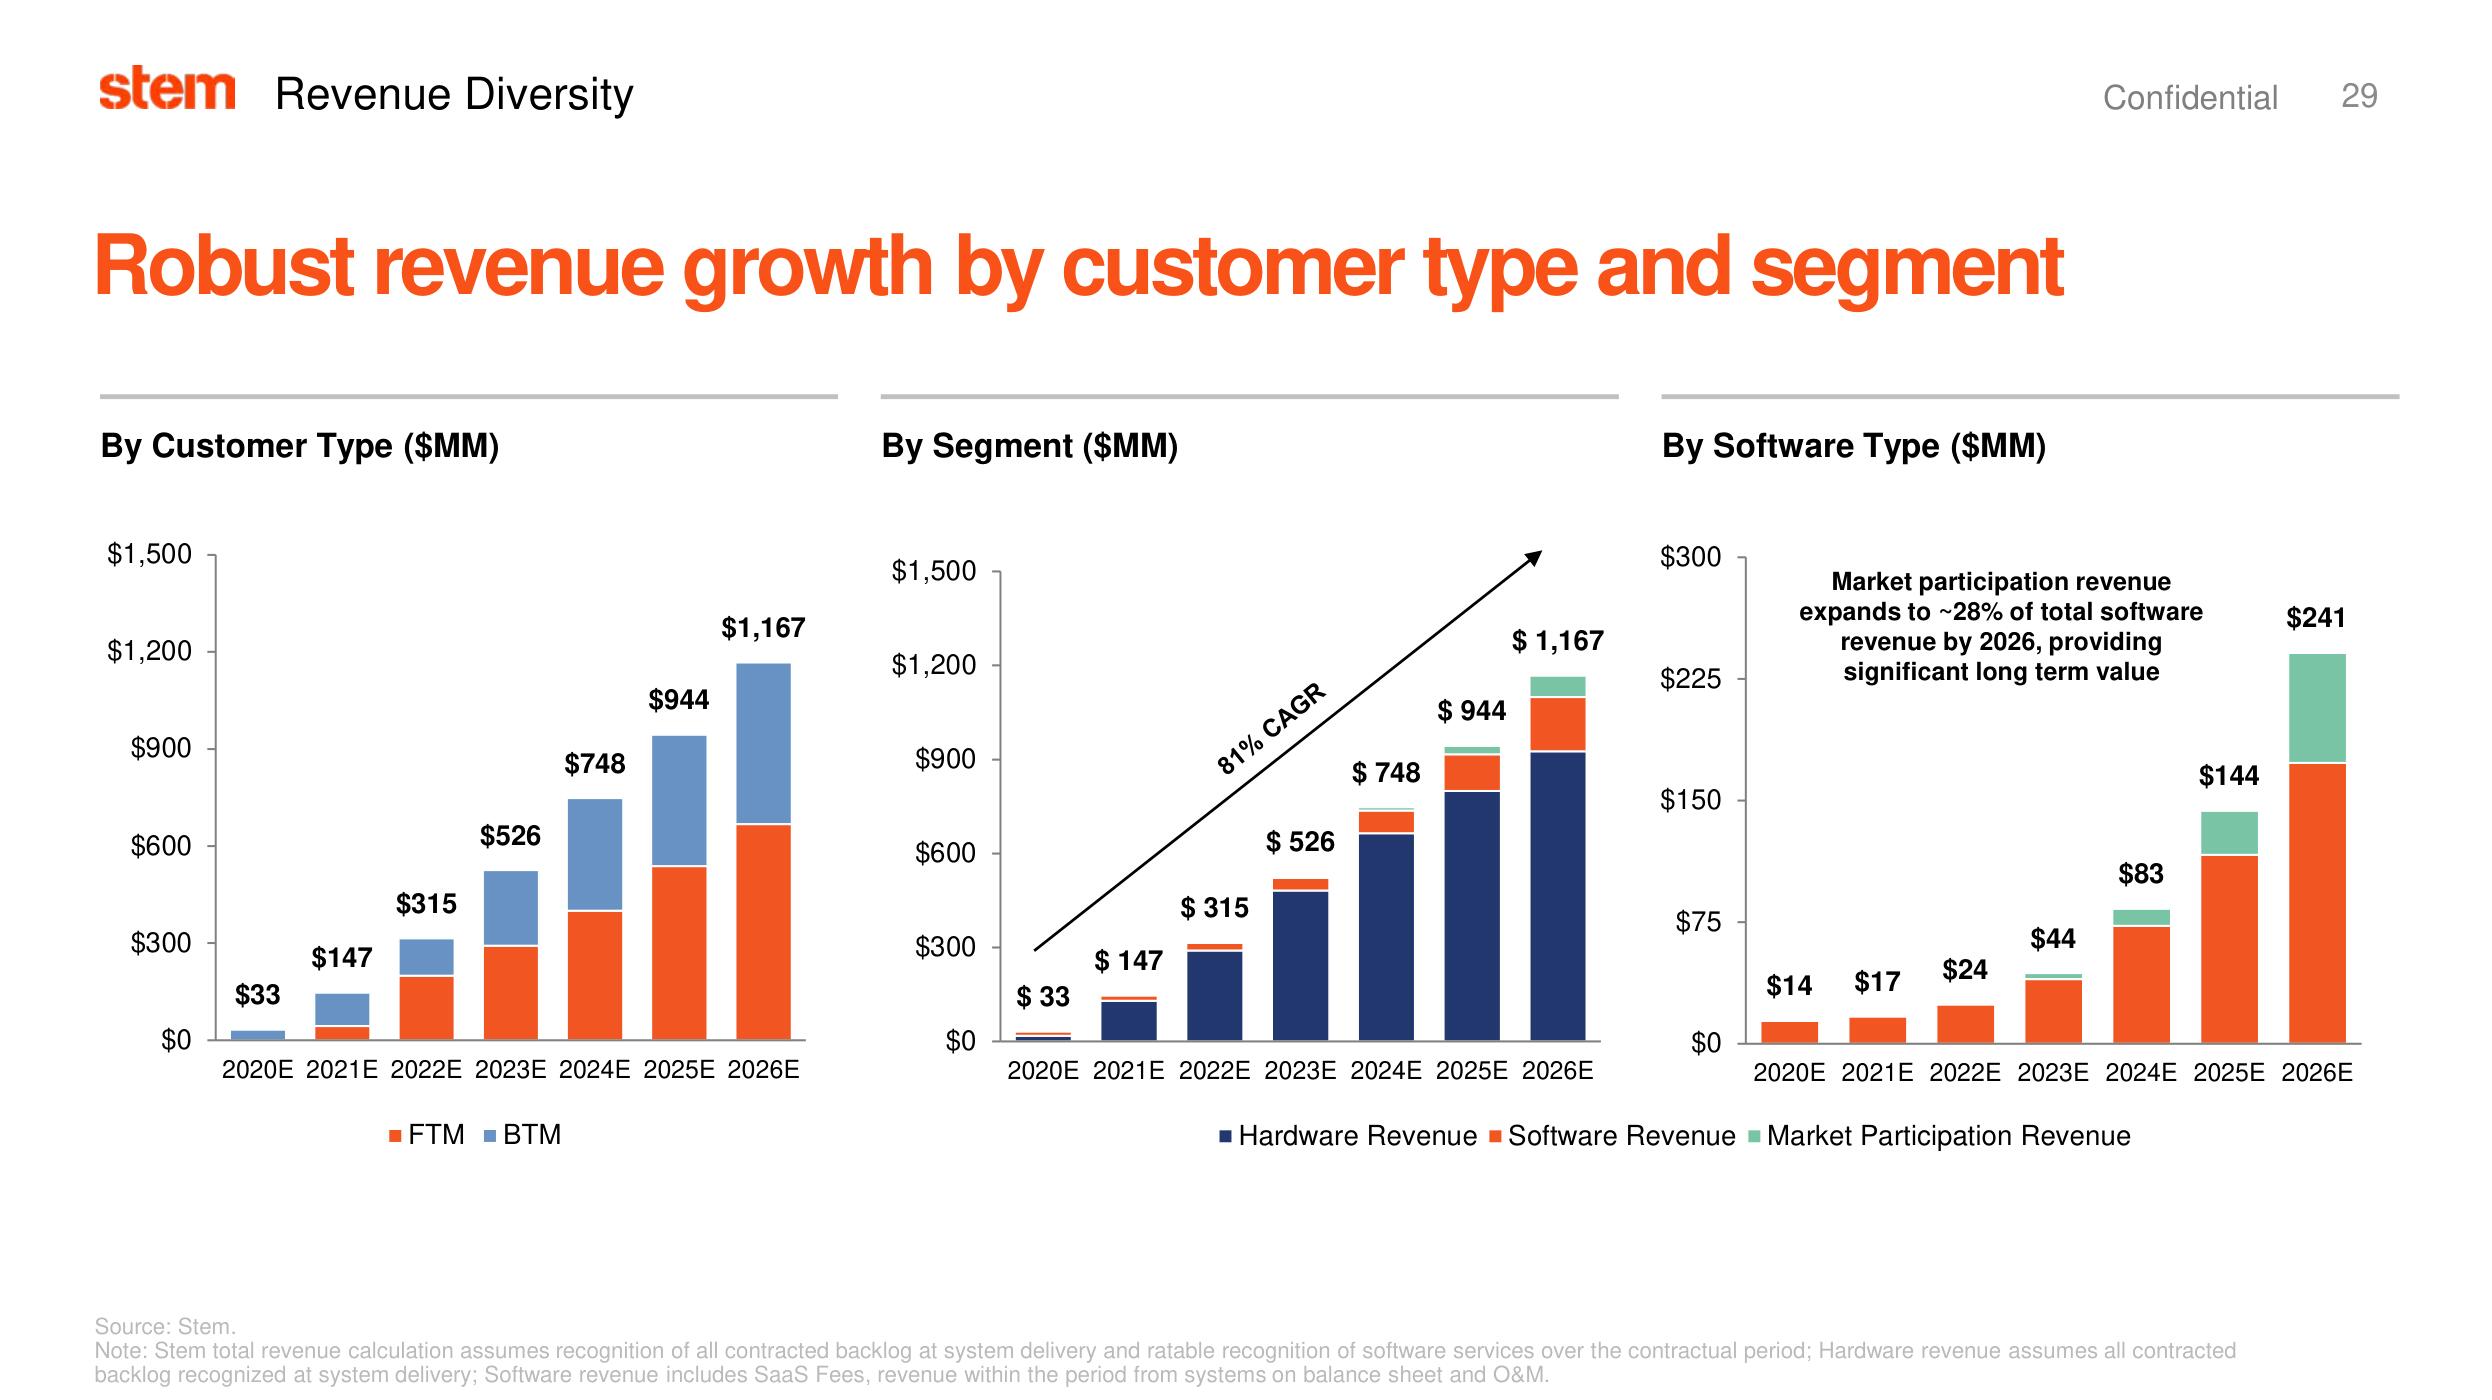
Robust revenue growth by customer type and segment
By Customer Type ($MM)
$1,500
$1,200
$900
$600
$300
$0
$33
$147
$315
$526
$748
■FTMBTM
$944
$1,167
2020E 2021E 2022E 2023E 2024E 2025E 2026E
By Segment ($MM)
$1,500
$1,200
$900
$600
$300
$0
$ 33
$147
81% CAGR
$315
$ 526
$748
$944
$ 1,167
2020E 2021E 2022E 2023E 2024E 2025E 2026E
By Software Type ($MM)
$300
$225
$150
$75
$0
Market participation revenue
expands to ~28% of total software
revenue by 2026, providing
significant long term value
$14
$17 $24
Confidential 29
$44
$83
$144
■Hardware Revenue Software Revenue Market Participation Revenue
2020E 2021E 2022E 2023E 2024E 2025E 2026E
$241
Source: Stem.
Note: Stem total revenue calculation assumes recognition of all contracted backlog at system delivery and ratable recognition of software services over the contractual period; Hardware revenue assumes all contracted
backlog recognized at system delivery; Software revenue includes SaaS Fees, revenue within the period from systems on balance sheet and O&M.View entire presentation