AMD Results Presentation Deck
16
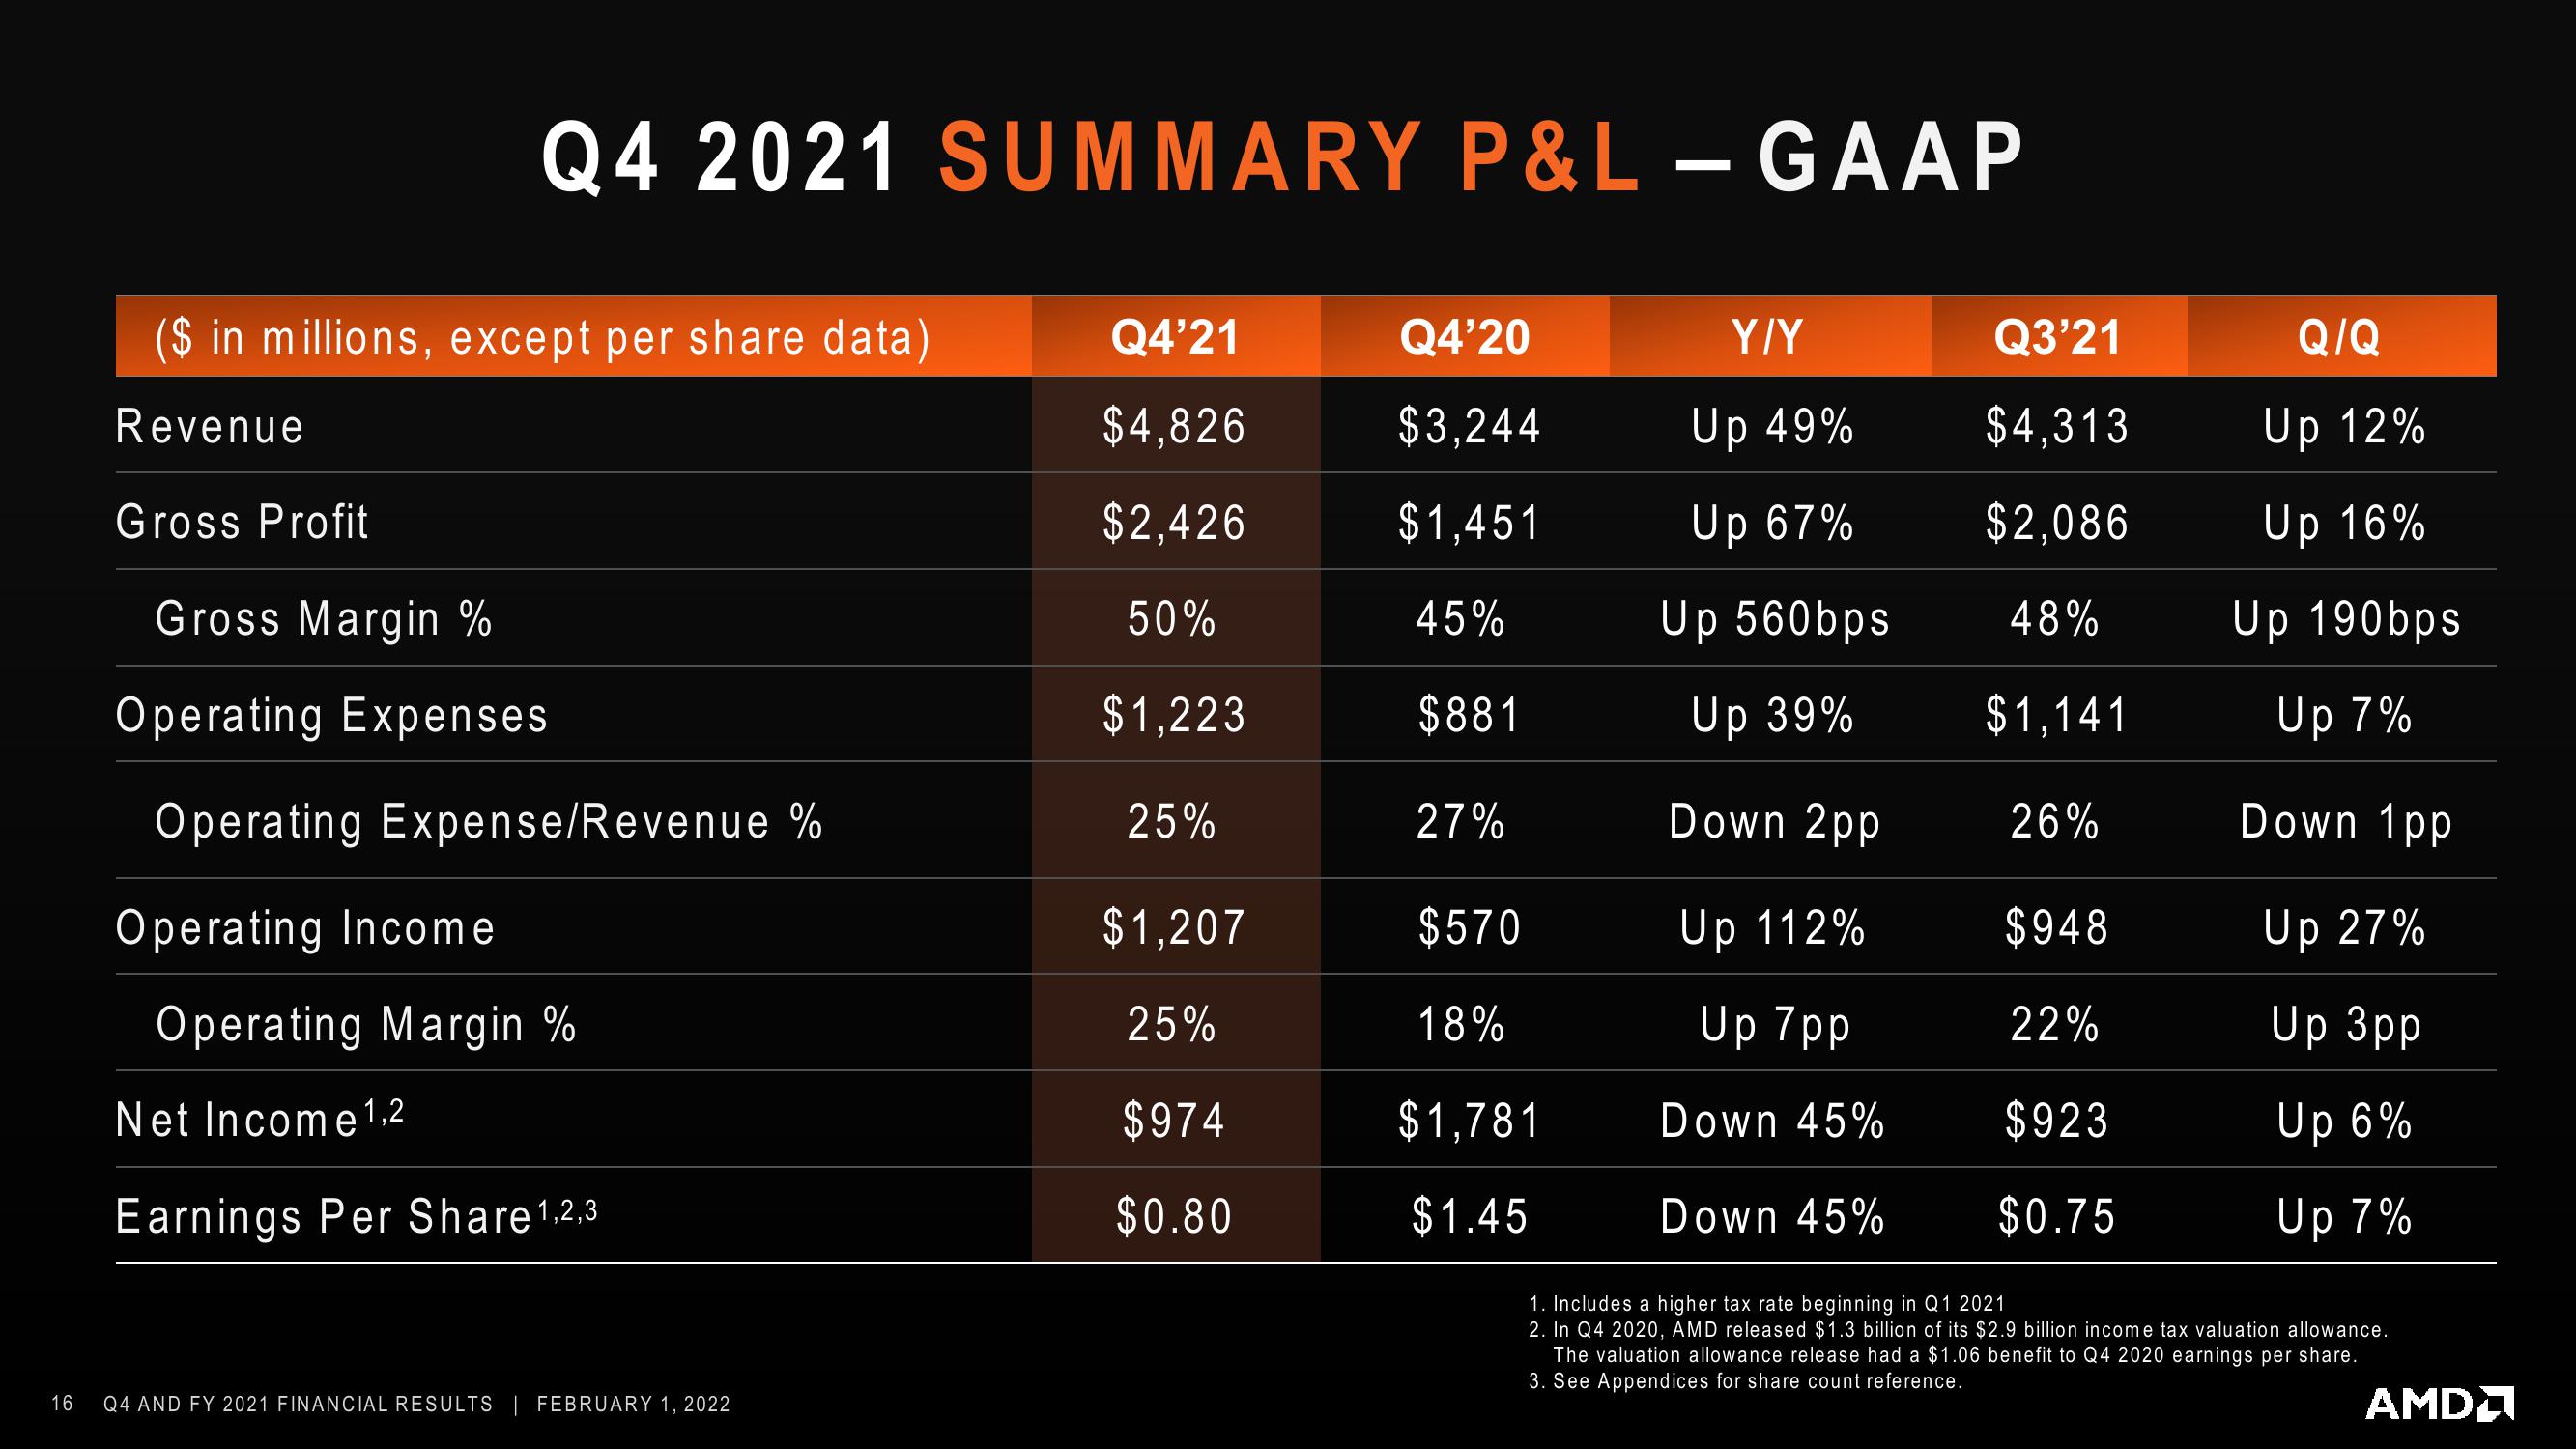
Q4 2021 SUMMARY P&L - GAAP
($ in millions, except per share data)
Revenue
Gross Profit
Gross Margin %
Operating Expenses
Operating Expense/Revenue %
Operating Income
Operating Margin %
Net Income ¹,2
Earnings Per Share 1,2,3
Q4 AND FY 2021 FINANCIAL RESULTS FEBRUARY 1, 2022
Q4'21
$4,826
$2,426
50%
$1,223
25%
$1,207
25%
$974
$0.80
Q4'20
$3,244
$1,451
45%
$881
27%
$570
18%
$1,781
$1.45
Y/Y
Up 49%
Up 67%
Up 560bps
Up 39%
Down 2pp
Up 112%
Up 7pp
Down 45%
Down 45%
Q3'21
$4,313
$2,086
48%
$1,141
26%
$948
22%
$923
$0.75
Q/Q
Up 12%
Up 16%
Up 190bps
Up 7%
Down 1pp
Up 27%
Up 3pp
Up 6%
Up 7%
1. Includes a higher tax rate beginning in Q1 2021
2. In Q4 2020, AMD released $1.3 billion of its $2.9 billion income tax valuation allowance.
The valuation allowance release had a $1.06 benefit to Q4 2020 earnings per share.
3. See Appendices for share count reference.
AMDView entire presentation