Nuvve SPAC Presentation Deck
●
Nuvve Comparable Company Benchmarking
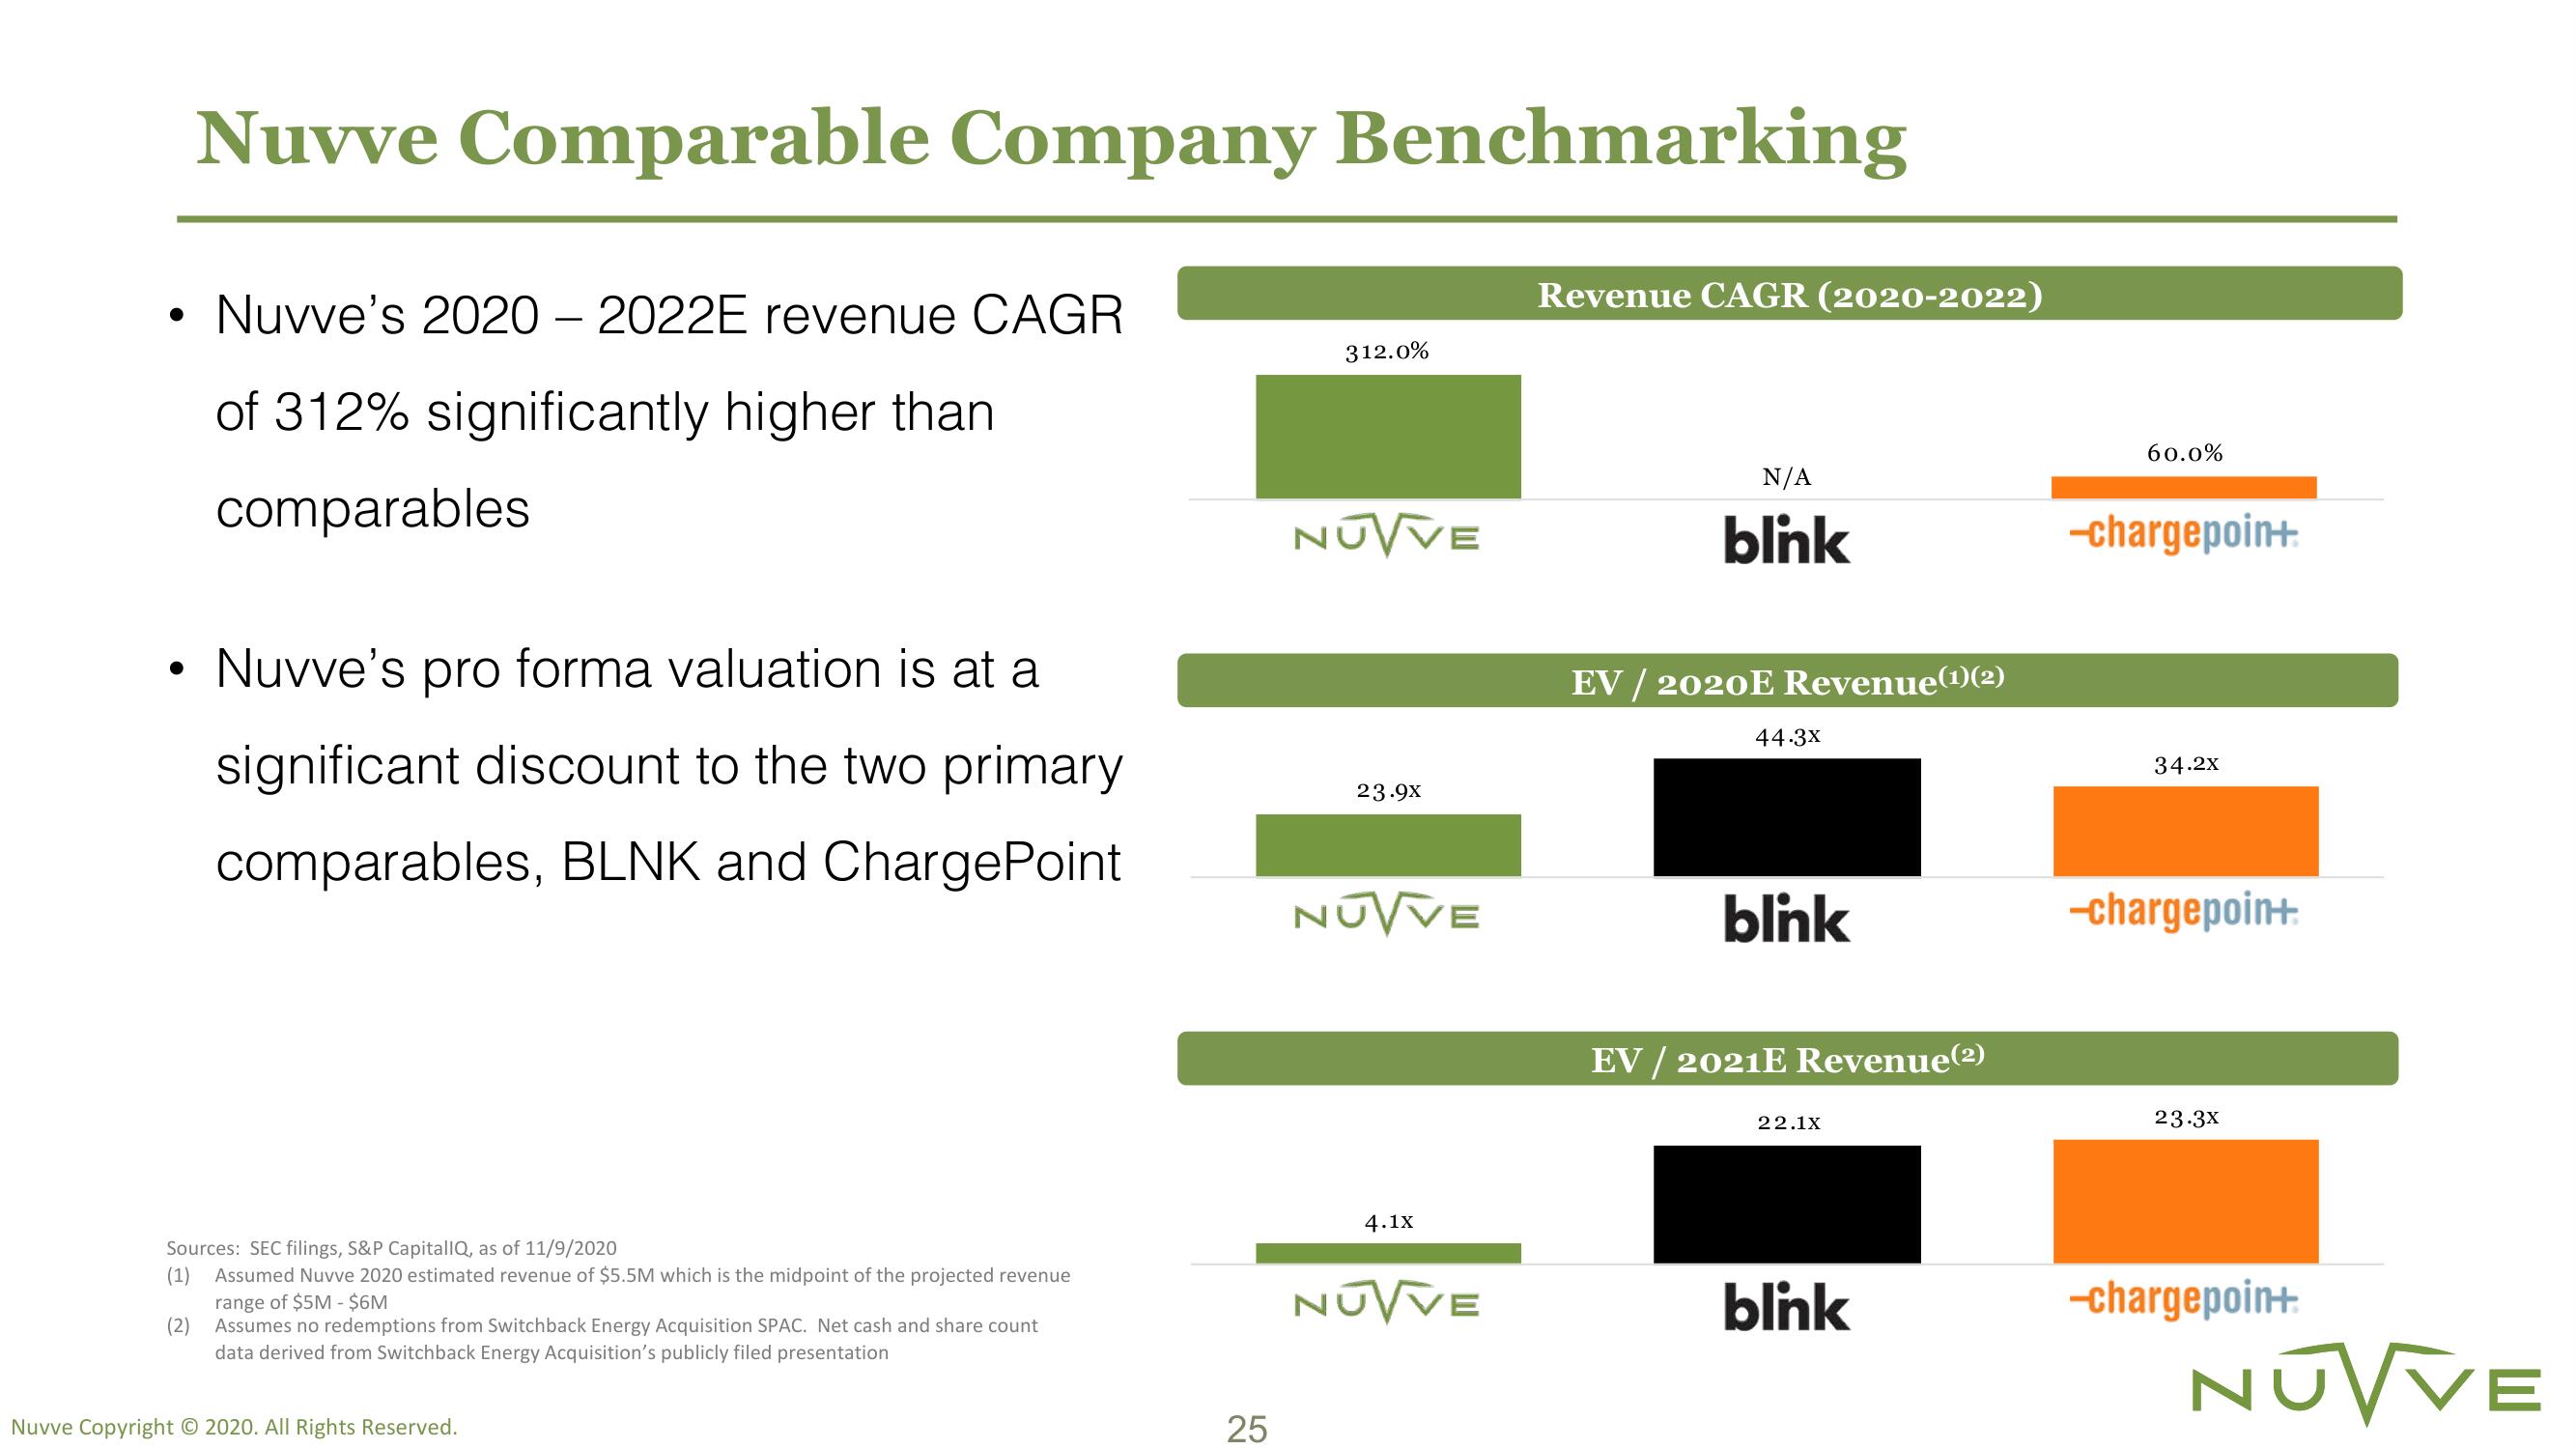
Nuvve's 2020-2022E revenue CAGR
of 312% significantly higher than
comparables
Nuvve's pro forma valuation is at a
significant discount to the two primary
comparables, BLNK and ChargePoint
Sources: SEC filings, S&P CapitallQ, as of 11/9/2020
(1) Assumed Nuvve 2020 estimated revenue of $5.5M which is the midpoint of the projected revenue
range of $5M - $6M
(2) Assumes no redemptions from Switchback Energy Acquisition SPAC. Net cash and share count
data derived from Switchback Energy Acquisition's publicly filed presentation
Nuvve Copyright © 2020. All Rights Reserved.
25
312.0%
NUVVE
23.9x
NUVVE
4.1x
NUVVE
Revenue CAGR (2020-2022)
N/A
blink
EV / 2020E Revenue(¹)(2)
44.3x
blink
EV / 2021E Revenue(2)
22.1X
blink
60.0%
-chargepoin+
34.2x
-chargepoin+:
23.3x
-chargepoin+
NUVVEView entire presentation