Allwyn Investor Presentation Deck
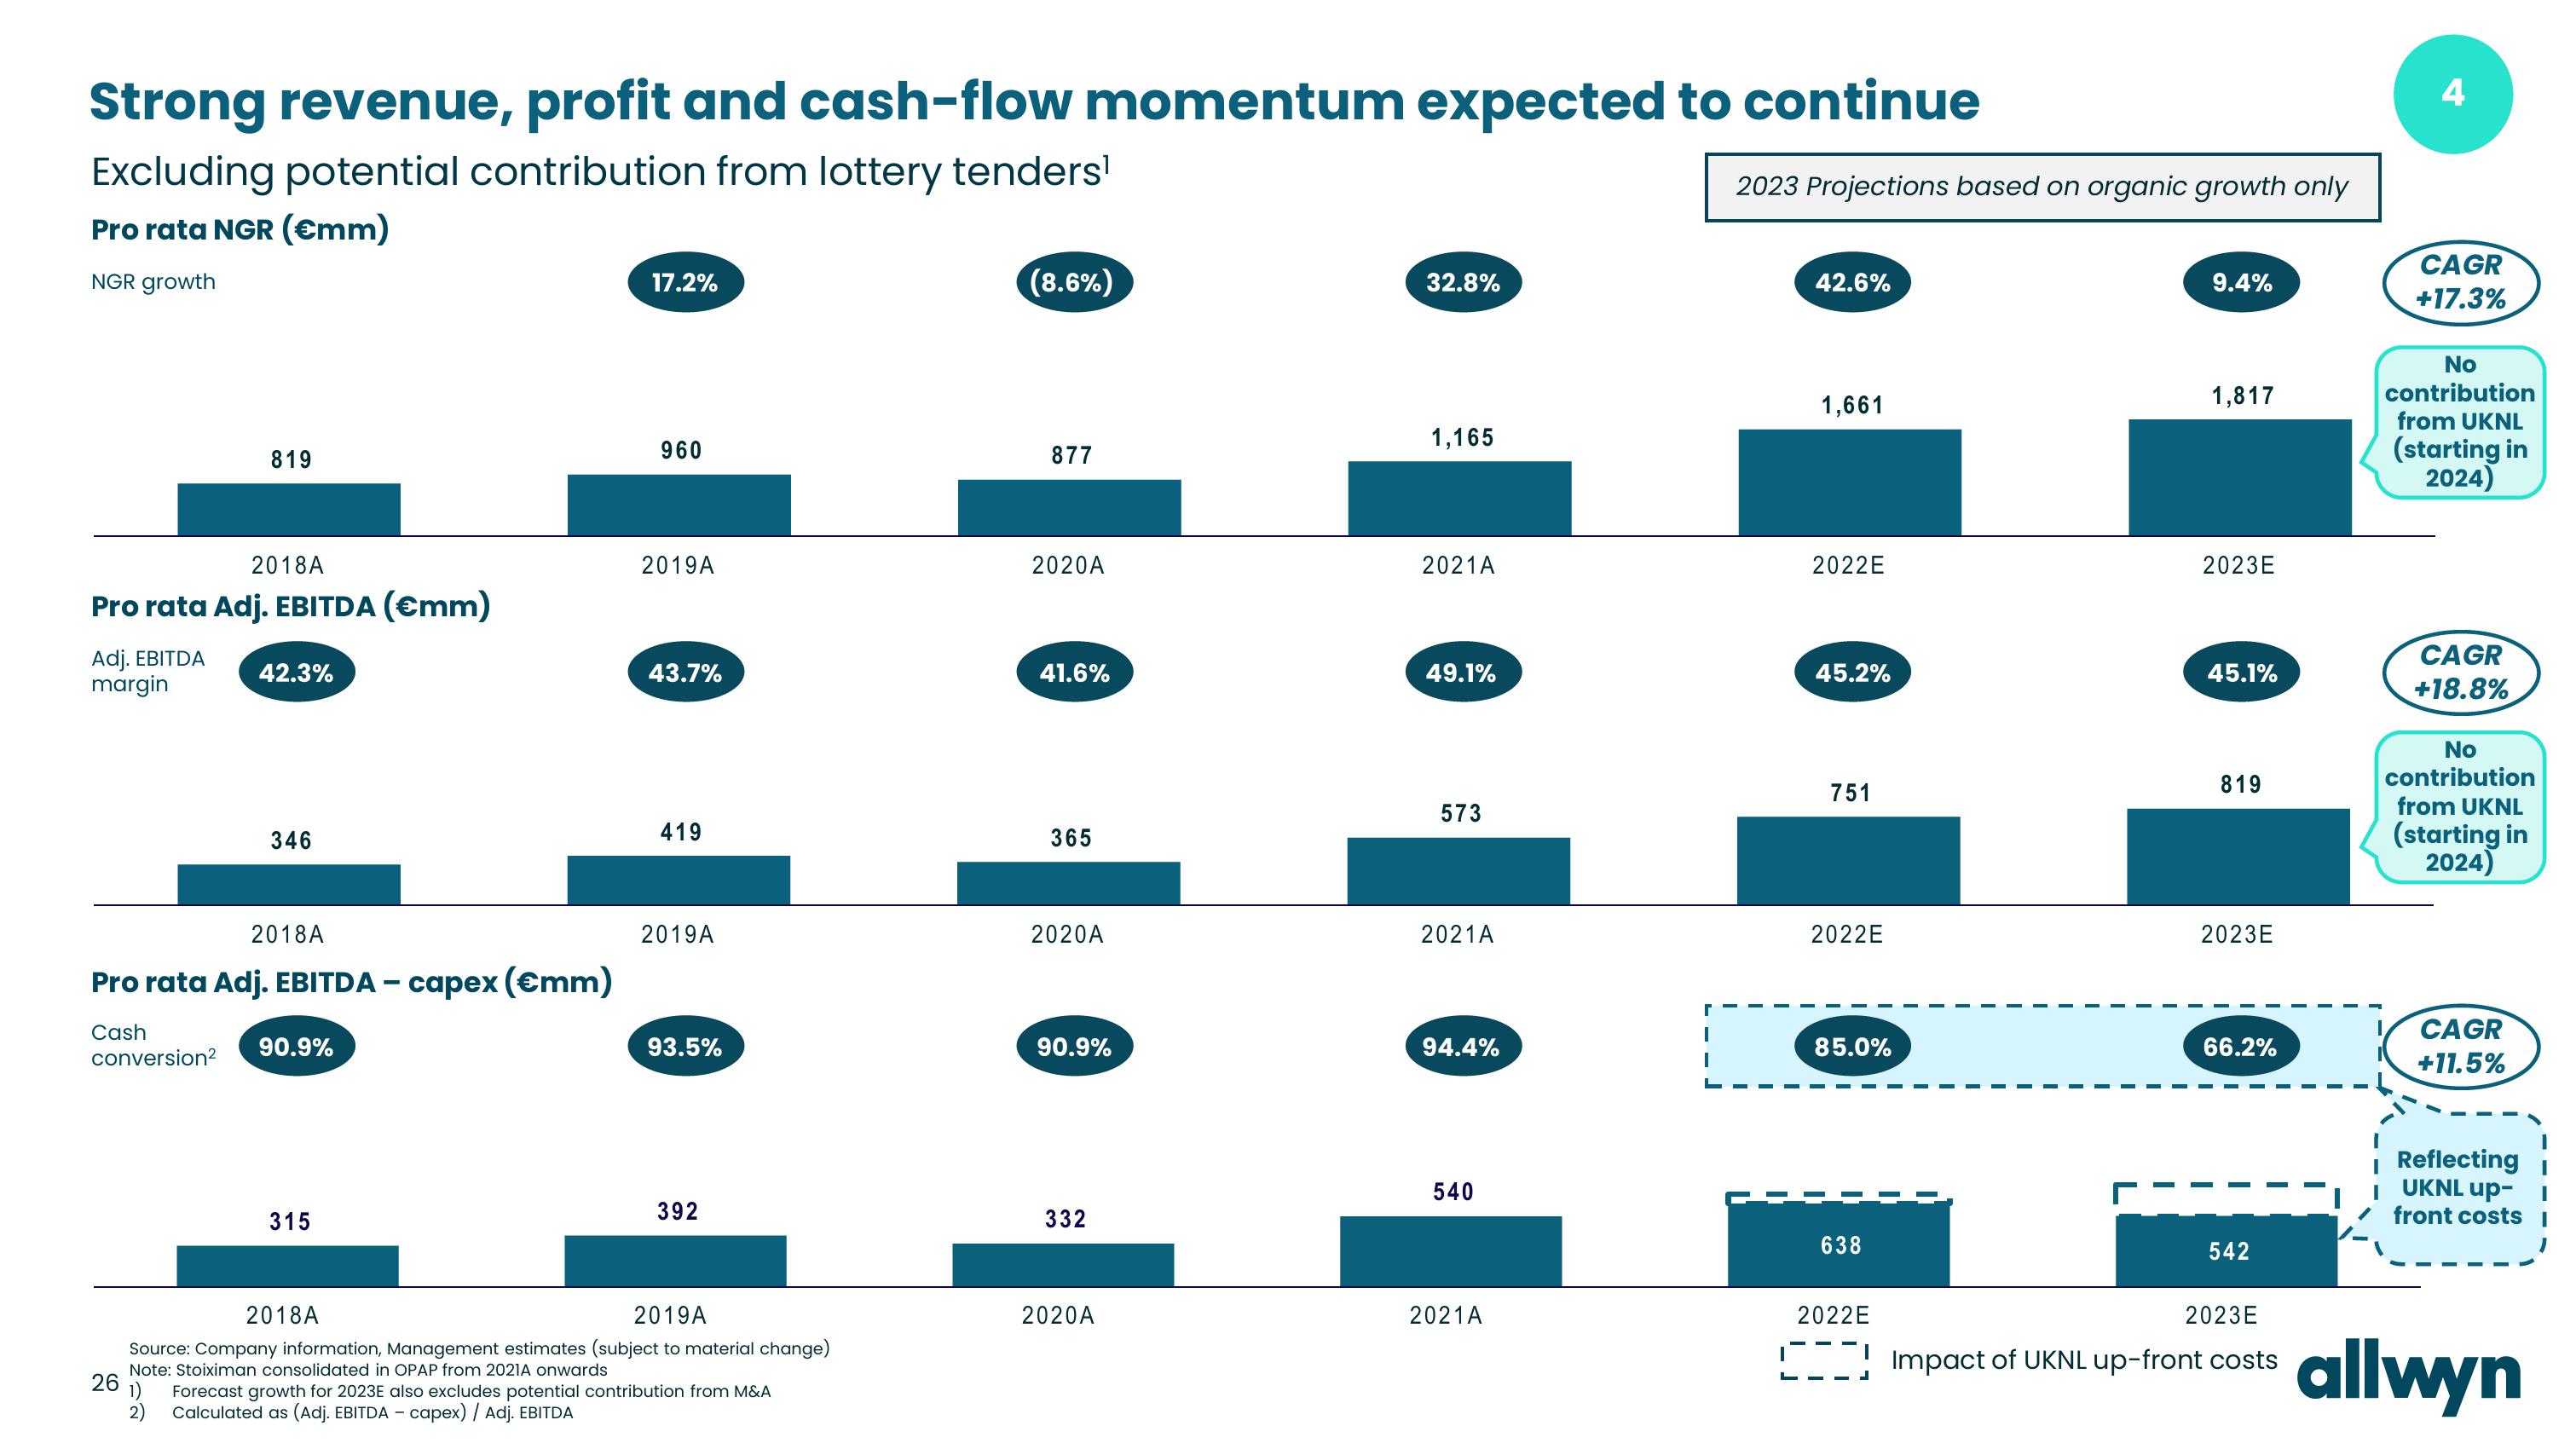
Strong revenue, profit and cash-flow momentum expected to continue
Excluding potential contribution from lottery tenders¹
Pro rata NGR (€mm)
NGR growth
2018A
Pro rata Adj. EBITDA (€mm)
Adj. EBITDA
margin
819
26
42.3%
2018A
Pro rata Adj. EBITDA - capex (€mm)
Cash
conversion²
1)
2)
346
90.9%
315
2018A
17.2%
960
2019A
43.7%
419
2019A
93.5%
392
2019A
Source: Company information, Management estimates (subject to material change)
Note: Stoiximan consolidated in OPAP from 2021A onwards
Forecast growth for 2023E also excludes potential contribution from M&A
Calculated as (Adj. EBITDA - capex) / Adj. EBITDA
(8.6%)
877
2020A
41.6%
365
2020A
90.9%
332
2020A
32.8%
1,165
2021A
49.1%
573
2021A
94.4%
540
2021A
2023 Projections based on organic growth only
42.6%
1,661
2022E
45.2%
751
2022E
85.0%
638
2022E
9.4%
1,817
2023E
45.1%
819
2023E
66.2%
542
2023E
Impact of UKNL up-front costs
4
CAGR
+17.3%
No
contribution
from UKNL
(starting in
2024)
CAGR
+18.8%
No
contribution
from UKNL
(starting in
2024)
CAGR
+11.5%
Reflecting
UKNL up-
front costs I
allwynView entire presentation