Altus Power SPAC Presentation Deck
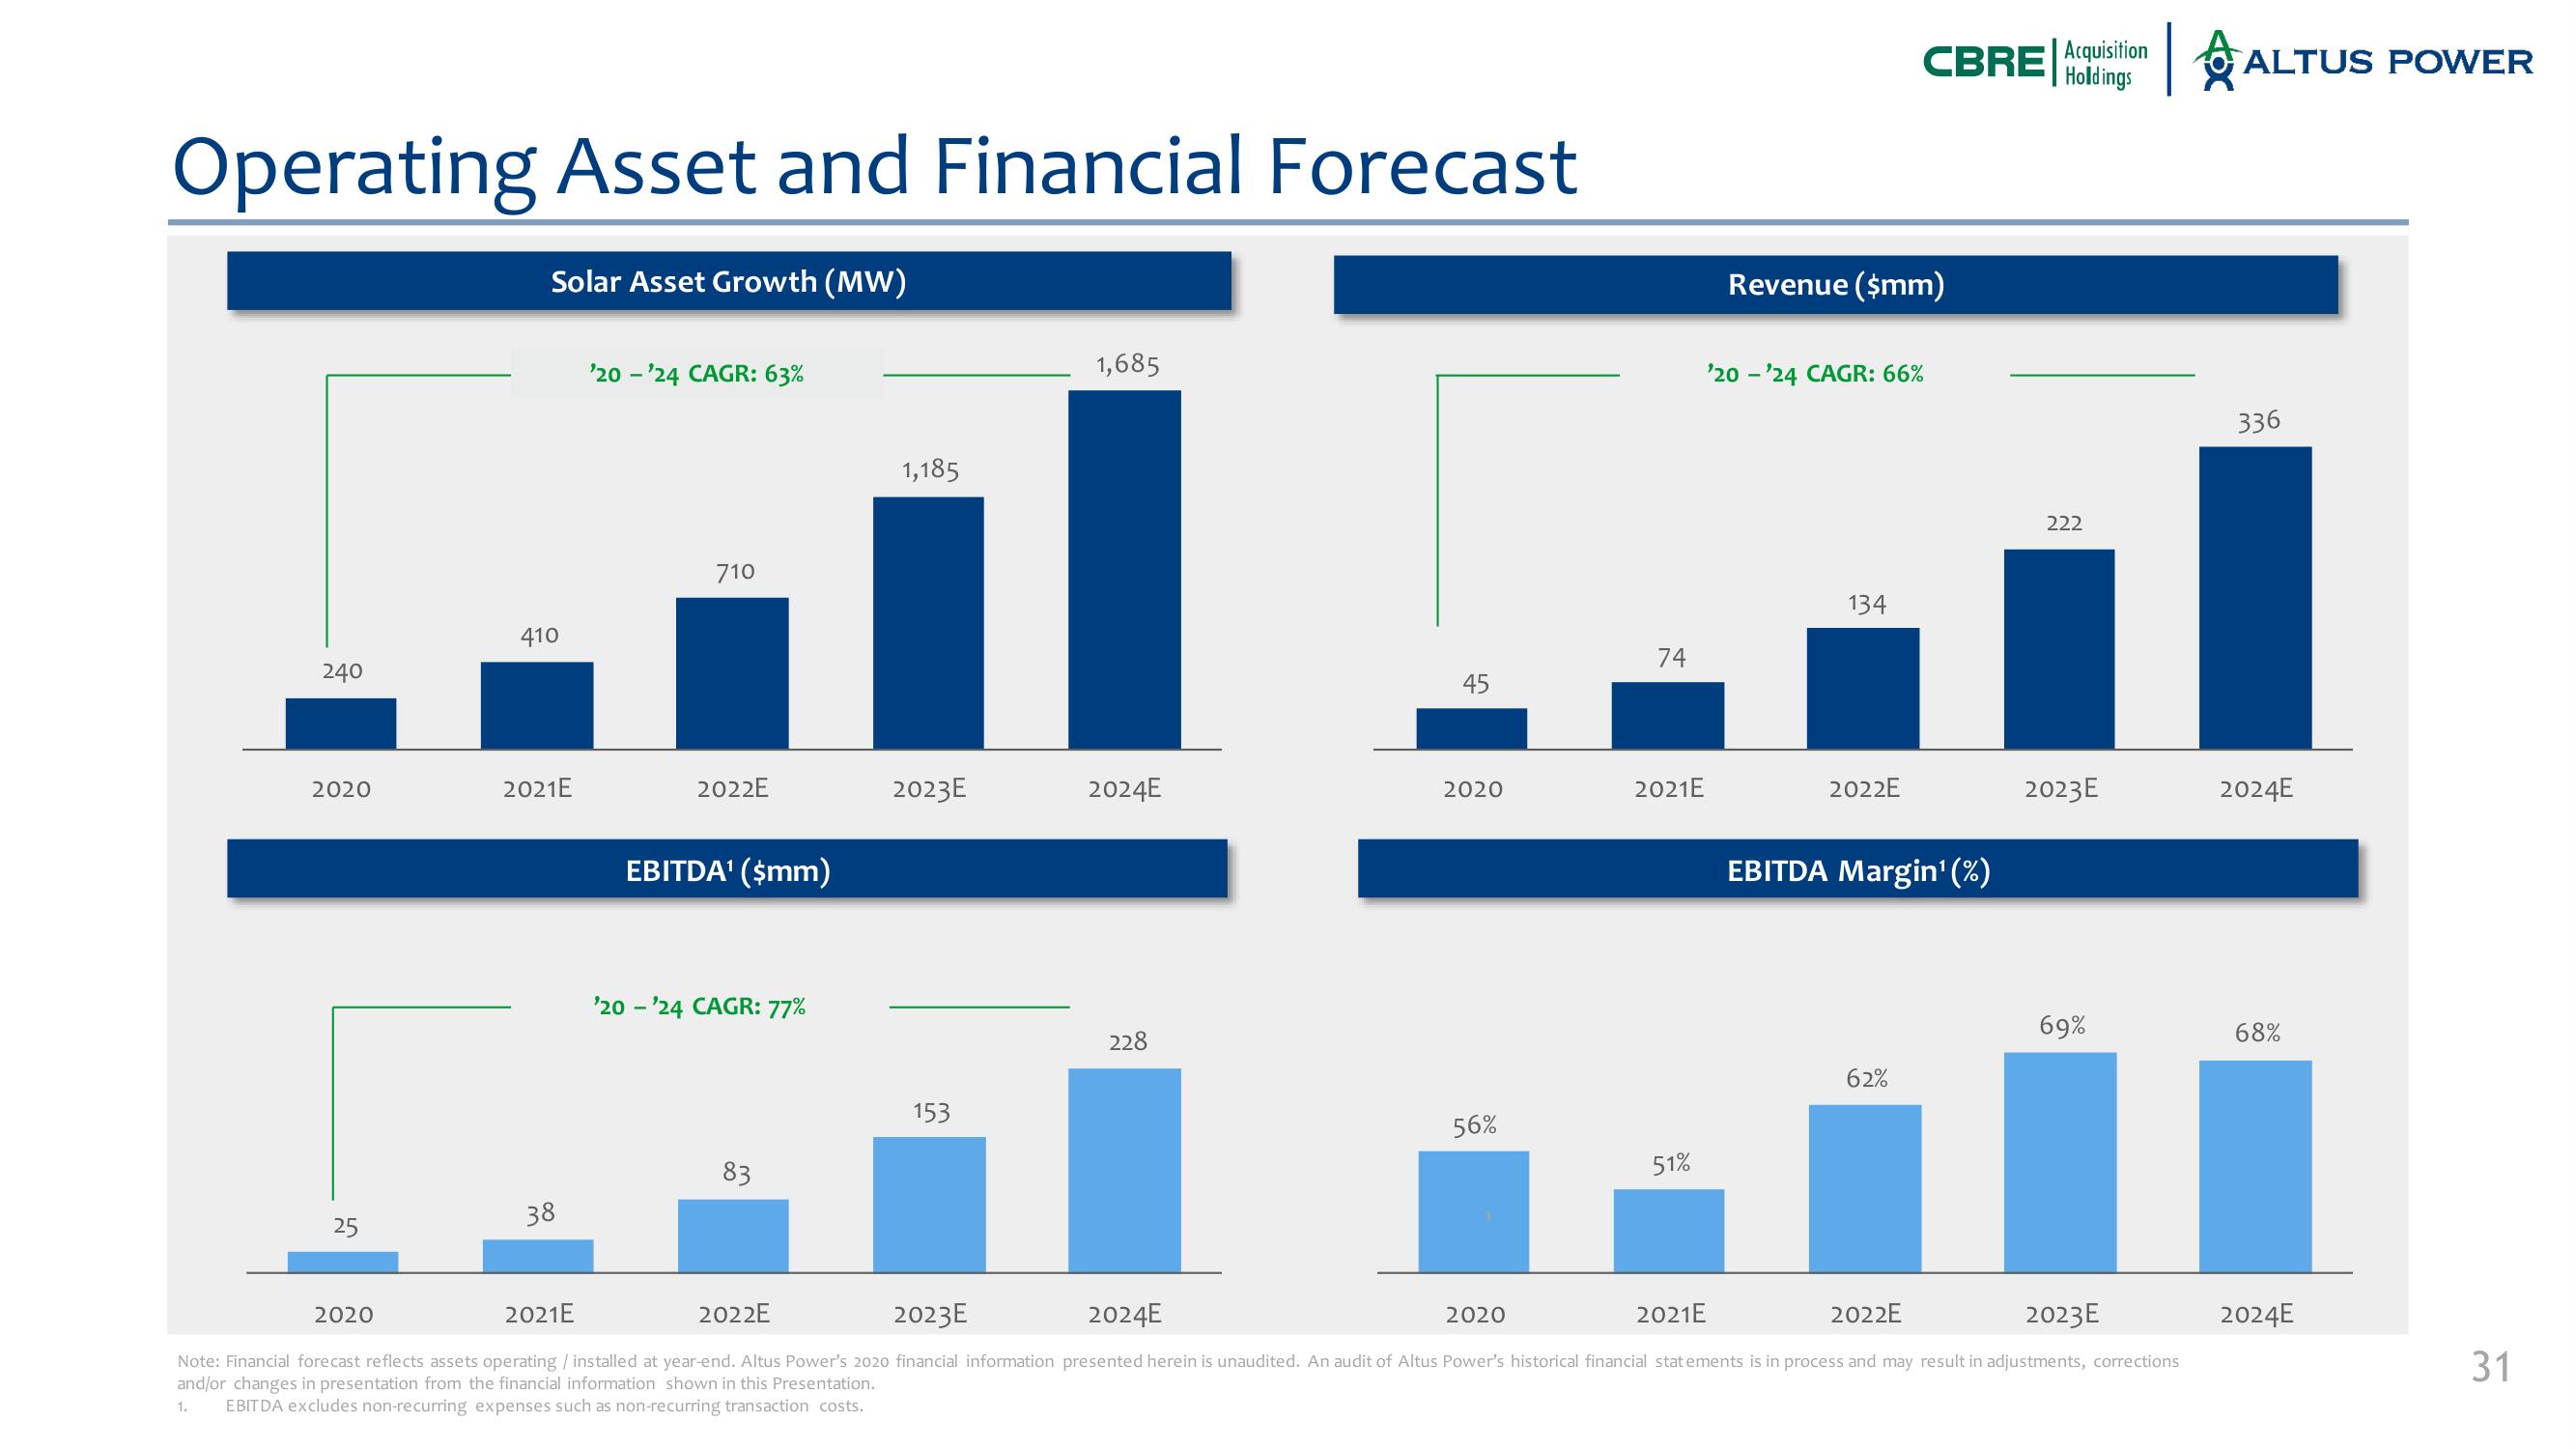
Operating Asset and Financial Forecast
Solar Asset Growth (MW)
240
2020
25
410
2020
2021E
38
'20'24 CAGR: 63%
710
2022E
EBITDA¹ (mm)
'20'24 CAGR: 77%
83
1,185
2022E
2023E
153
1,685
2024E
228
45
2020
56%
74
2020
2021E
51%
2021E
Revenue ($mm)
'20'24 CAGR: 66%
134
CBRE Acquisition
Holdings
2022E
EBITDA Margin¹(%)
62%
2021E
2023E
2024E
2022E
2023E
Note: Financial forecast reflects assets operating / installed at year-end. Altus Power's 2020 financial information presented herein is unaudited. An audit of Altus Power's historical financial statements is in process and may result in adjustments, corrections
and/or changes in presentation from the financial information shown in this Presentation.
1.
EBITDA excludes non-recurring expenses such as non-recurring transaction costs.
222
2023E
69%
ALTUS POWER
336
2024E
68%
2024E
31View entire presentation