Ashtead Group Results Presentation Deck
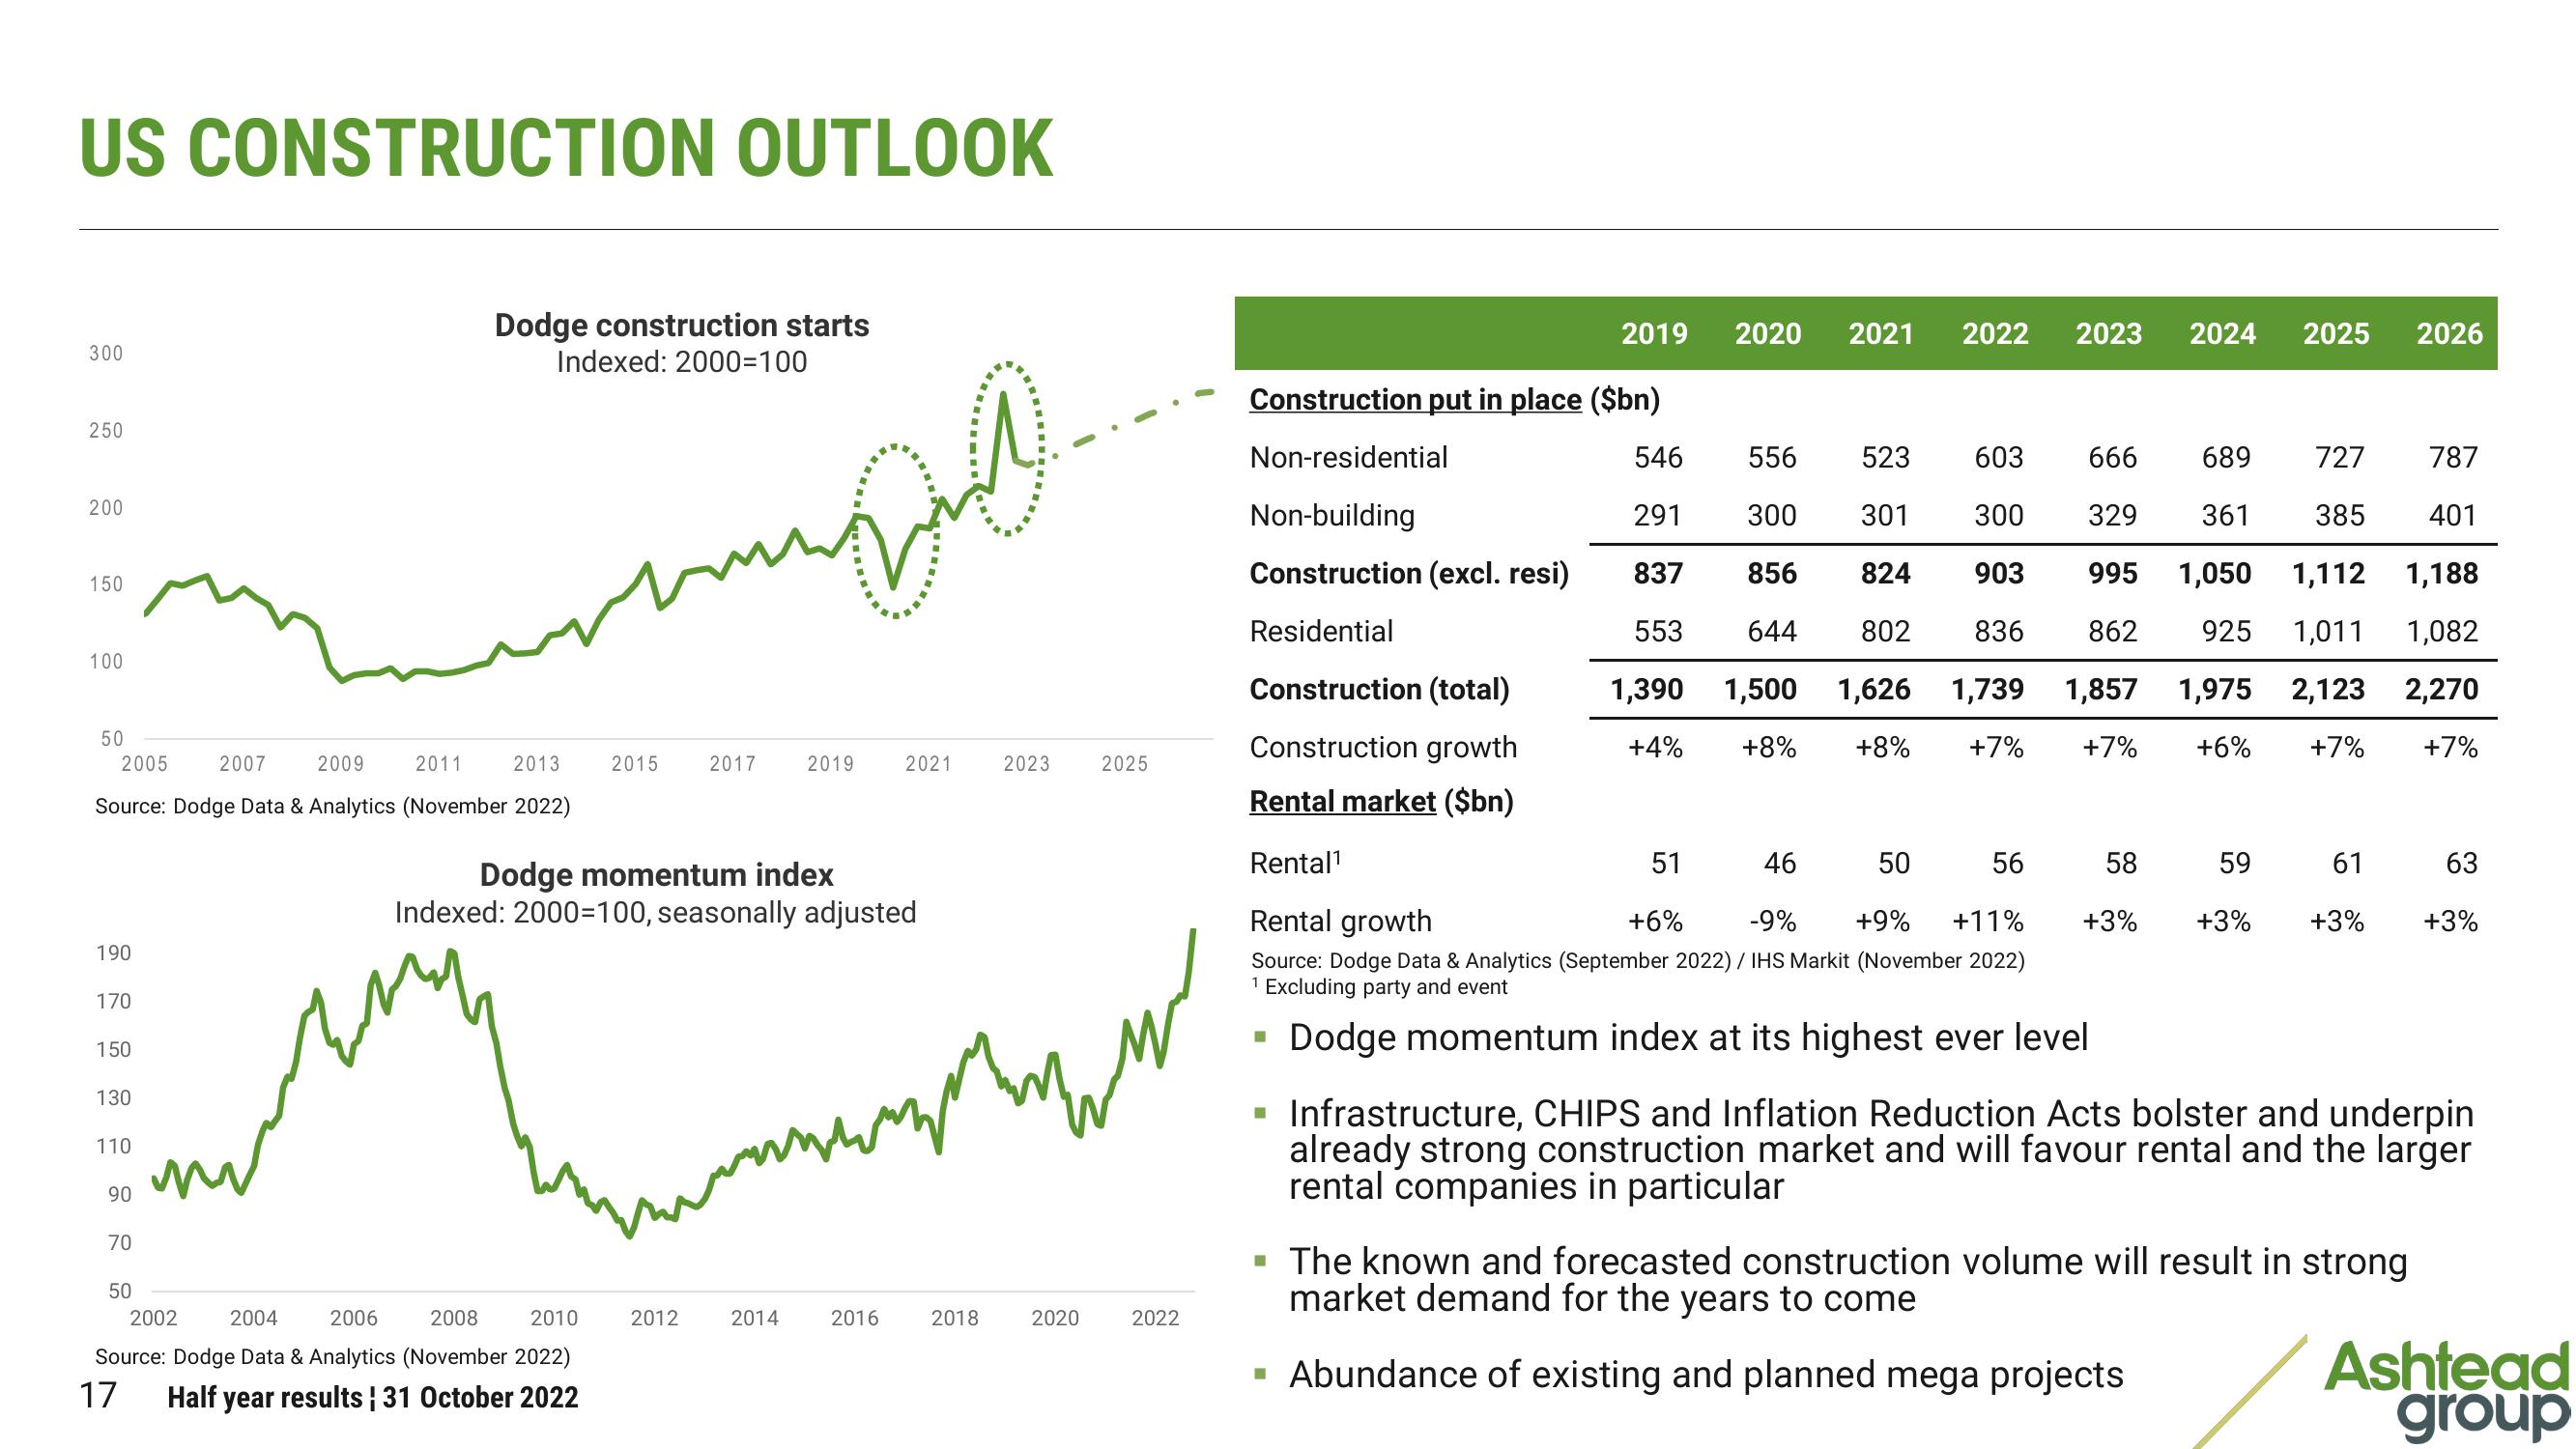
US CONSTRUCTION OUTLOOK
300
250
200
150
100
50
2005
2007 2009 2011 2013
Source: Dodge Data & Analytics (November 2022)
190
170
150
130
110
90
Dodge construction starts
Indexed: 2000=100
70
2015
50
2002 2004 2006 2008 2010
Source: Dodge Data & Analytics (November 2022)
17
Half year results ¦ 31 October 2022
2017
2012
BD
Dodge momentum index
Indexed: 2000=100, seasonally adjusted
2014
2019
2021
2016
научи
2023
2018
2020
2025
2022
2019 2020
Construction put in place ($bn)
Non-residential
■
2021
2022 2023 2024
Non-building
Construction (excl. resi)
Residential
Construction (total)
Construction growth
Rental market ($bn)
Rental¹
46 50
Rental growth
-9% +9% +11%
Source: Dodge Data & Analytics (September 2022) / IHS Markit (November 2022)
¹ Excluding party and event
51
+6%
Dodge momentum index at its highest ever level
546
556
523
603
666 689 727
787
291
300
301
300
361
385
401
837
856
824
903
329
995
1,050 1,112 1,188
862 925 1,011 1,082
644 802 836
553
1,390 1,500 1,626 1,739 1,857 1,975 2,123 2,270
+4% +8% +8% +7% +7% +6% +7% +7%
56
2025 2026
58
+3%
59 61 63
+3% +3% +3%
Infrastructure, CHIPS and Inflation Reduction Acts bolster and underpin
already strong construction market and will favour rental and the larger
rental companies in particular
The known and forecasted construction volume will result in strong
market demand for the years to come
▪ Abundance of existing and planned mega projects
Ashtead
groupView entire presentation