FGI Industries Investor Presentation Deck
Quarterly Consolidated Financial Results
Total Revenue
$MM
Gross Profit
$MM
$38.5
23
$29.9
3Q22 3Q23
$182.1
$118.1
LTM - LTM -
3Q22 3Q23
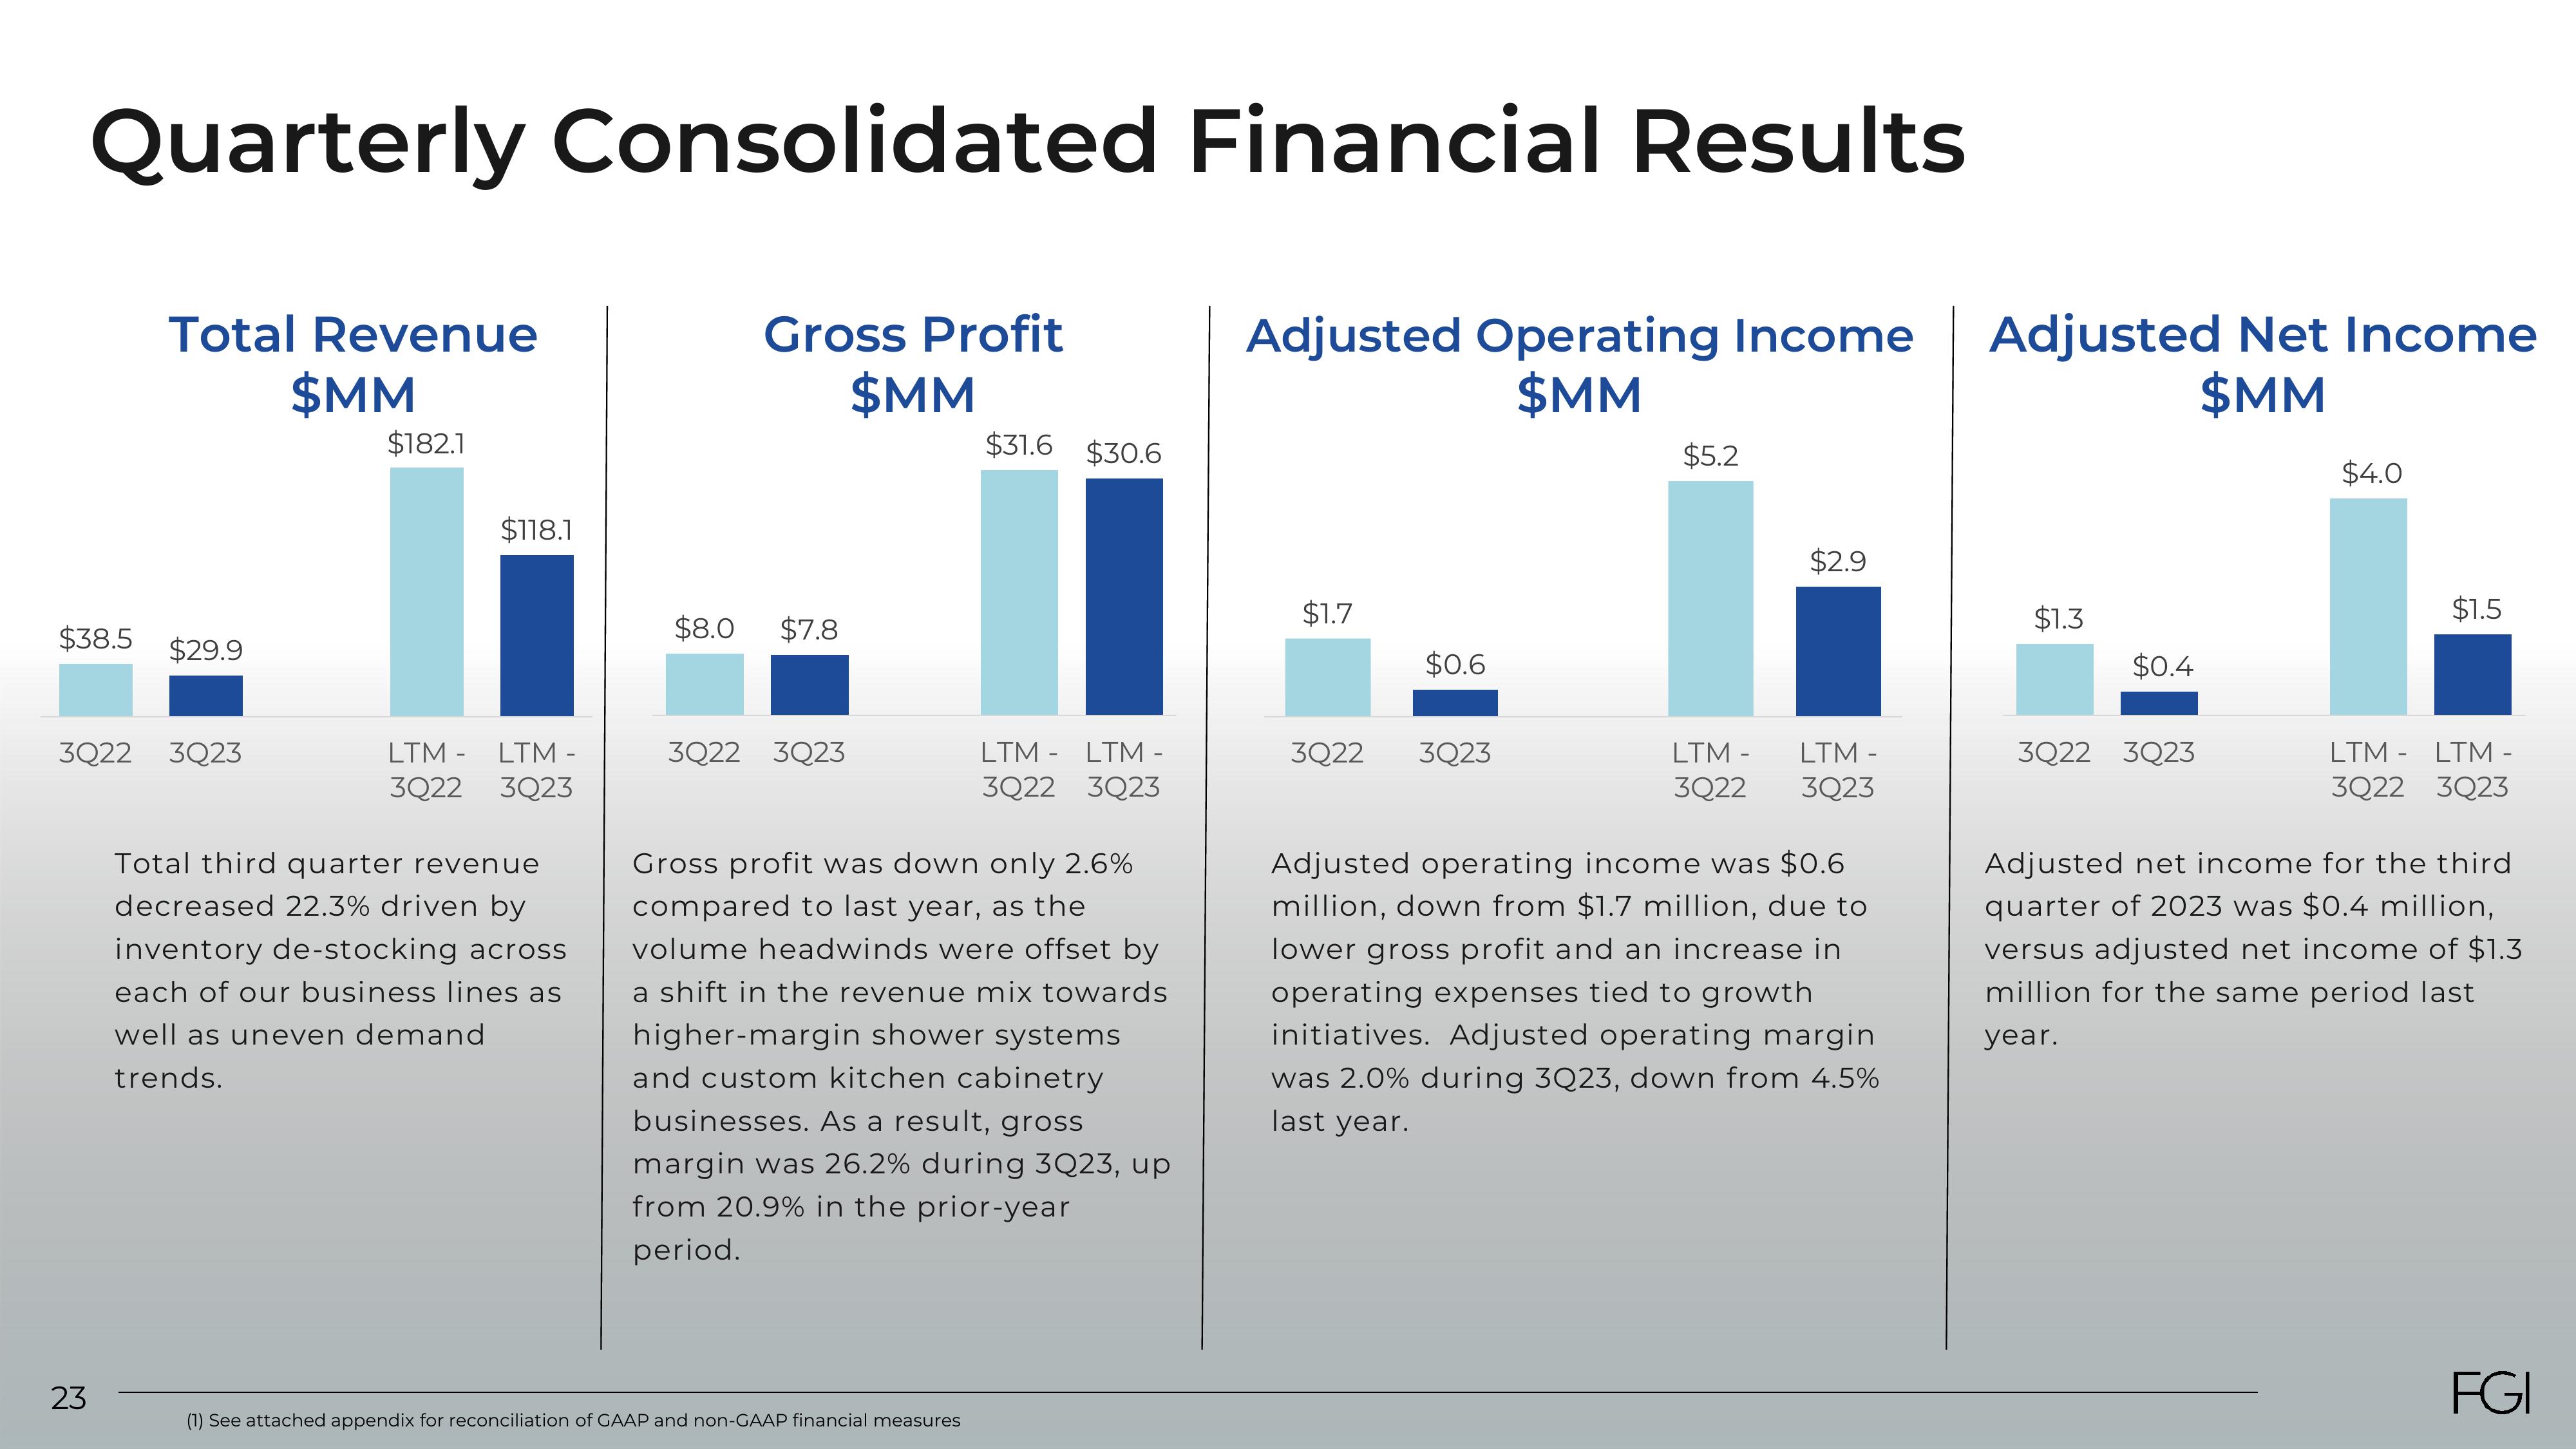
Total third quarter revenue
decreased 22.3% driven by
inventory de-stocking across
each of our business lines as
well as uneven demand
trends.
$8.0
$7.8
3Q22 3Q23
$31.6 $30.6
(1) See attached appendix for reconciliation of GAAP and non-GAAP financial measures
LTM LTM -
3Q22 3Q23
Gross profit was down only 2.6%
compared to last year, as the
volume headwinds were offset by
a shift in the revenue mix towards
higher-margin shower systems
and custom kitchen cabinetry
businesses. As a result, gross
margin was 26.2% during 3Q23, up
from 20.9% in the prior-year
period.
Adjusted Operating Income Adjusted Net Income
$MM
$MM
$1.7
3Q22
$0.6
3Q23
$5.2
$2.9
LTM - LTM -
3Q22 3Q23
Adjusted operating income was $0.6
million, down from $1.7 million, due to
lower gross profit and an increase in
operating expenses tied to growth
initiatives. Adjusted operating margin
was 2.0% during 3Q23, down from 4.5%
last year.
$1.3
$0.4
3Q22 3Q23
$4.0
$1.5
LTM LTM -
3Q22 3Q23
Adjusted net income for the third
quarter of 2023 was $0.4 million,
versus adjusted net income of $1.3
million for the same period last
year.
FGIView entire presentation