Baird Investment Banking Pitch Book
AR'S INCREASED TRANSPARENCY IN FINANCIAL REPORTING
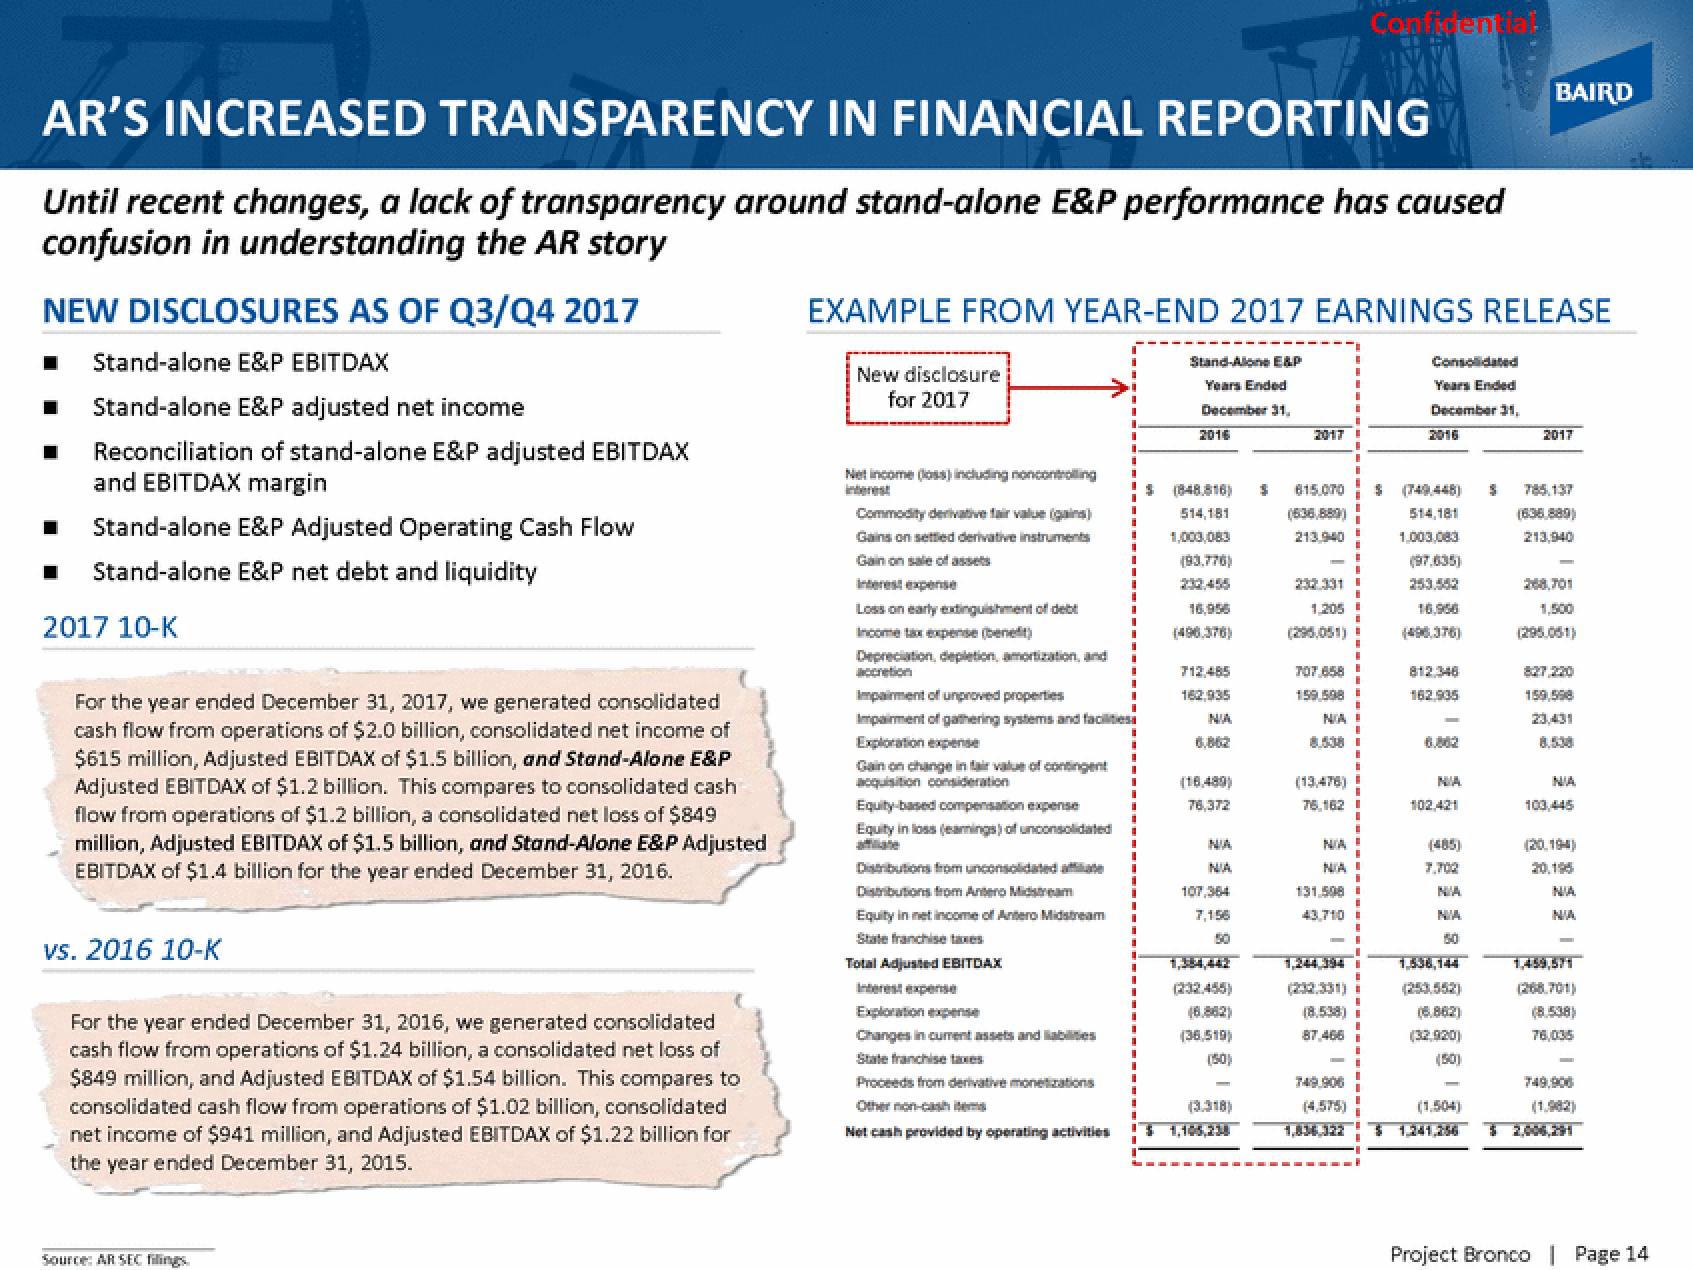
Until recent changes, a lack of transparency around stand-alone E&P performance has caused
confusion in understanding the AR story
NEW DISCLOSURES AS OF Q3/Q4 2017
Stand-alone E&P EBITDAX
Stand-alone E&P adjusted net income
Reconciliation of stand-alone E&P adjusted EBITDAX
and EBITDAX margin
Stand-alone E&P Adjusted Operating Cash Flow
Stand-alone E&P net debt and liquidity
2017 10-K
For the year ended December 31, 2017, we generated consolidated
cash flow from operations of $2.0 billion, consolidated net income of
$615 million, Adjusted EBITDAX of $1.5 billion, and Stand-Alone E&P
Adjusted EBITDAX of $1.2 billion. This compares to consolidated cash
flow from operations of $1.2 billion, a consolidated net loss of $849
million, Adjusted EBITDAX of $1.5 billion, and Stand-Alone E&P Adjusted
EBITDAX of $1.4 billion for the year ended December 31, 2016.
vs. 2016 10-K
For the year ended December 31, 2016, we generated consolidated
cash flow from operations of $1.24 billion, a consolidated net loss of
$849 million, and Adjusted EBITDAX of $1.54 billion. This compares to
consolidated cash flow from operations of $1.02 billion, consolidated
net income of $941 million, and Adjusted EBITDAX of $1.22 billion for
the year ended December 31, 2015.
Source: AR SEC filings
New disclosure
for 2017
EXAMPLE FROM YEAR-END 2017 EARNINGS RELEASE
Stand-Alone E&P
Years Ended
December 31.
Net income (los) including noncontrolling
Commodity derivative fair value (gains)
Gains on settled derivative instruments
Loss on early extinguishment of debt
Depreciation, depletion, amortization, and
Impairment of unproved properties
Impairment of gathering systems and facilities
Exploration expense
Gain on change in fair value of contingent
acquisition consideration
Equity-based compensation expense
Equity in loss (earnings) of unconsolidated
Distributions from unconsolidated afte
Distributions from Antero Midstream
Equity in net income of Antero Midstream
State franchise taxes
Total Adjusted EBITDAX
Interest expense
Exploration expense
Changes in current assets and liabilities
State franchise taxes
Proceeds from derivative monetizations
Net cash provided by operating activities
2016
$ (848,816)
514,181
1,003,083
(93.776)
16,956
712,485
162,935
76,372
107,364
7,156
(232.455)
(36,519)
(50)
(3.318)
2017
615.070 $
(636,889)
213.940
232.331
1.205
(295,051)
159.508
NIA
8,538
(13,476)
75,162
NIA
NIA
Confidential
131.508
43,710
(8.538)
87,466
749.906
(4.575)
Consolidated
Years Ended
December 31,
2016
514,181
1,003.083
(97.635)
253.552
16,956
(496,376)
162.935
102,421
(485)
7,702
NIA
NIA
(6.862)
(32.920)
(50)
(1.504)
BAIRD
$
2017
213,940
268,701
1,500
(295.051)
159,598
103,445
(20,194)
20,195
NIA
NA
(268.701)
(8.538)
76,035
749,900
Project Bronco | Page 14View entire presentation