Spotify Results Presentation Deck slide image

Spotify Results Presentation Deck

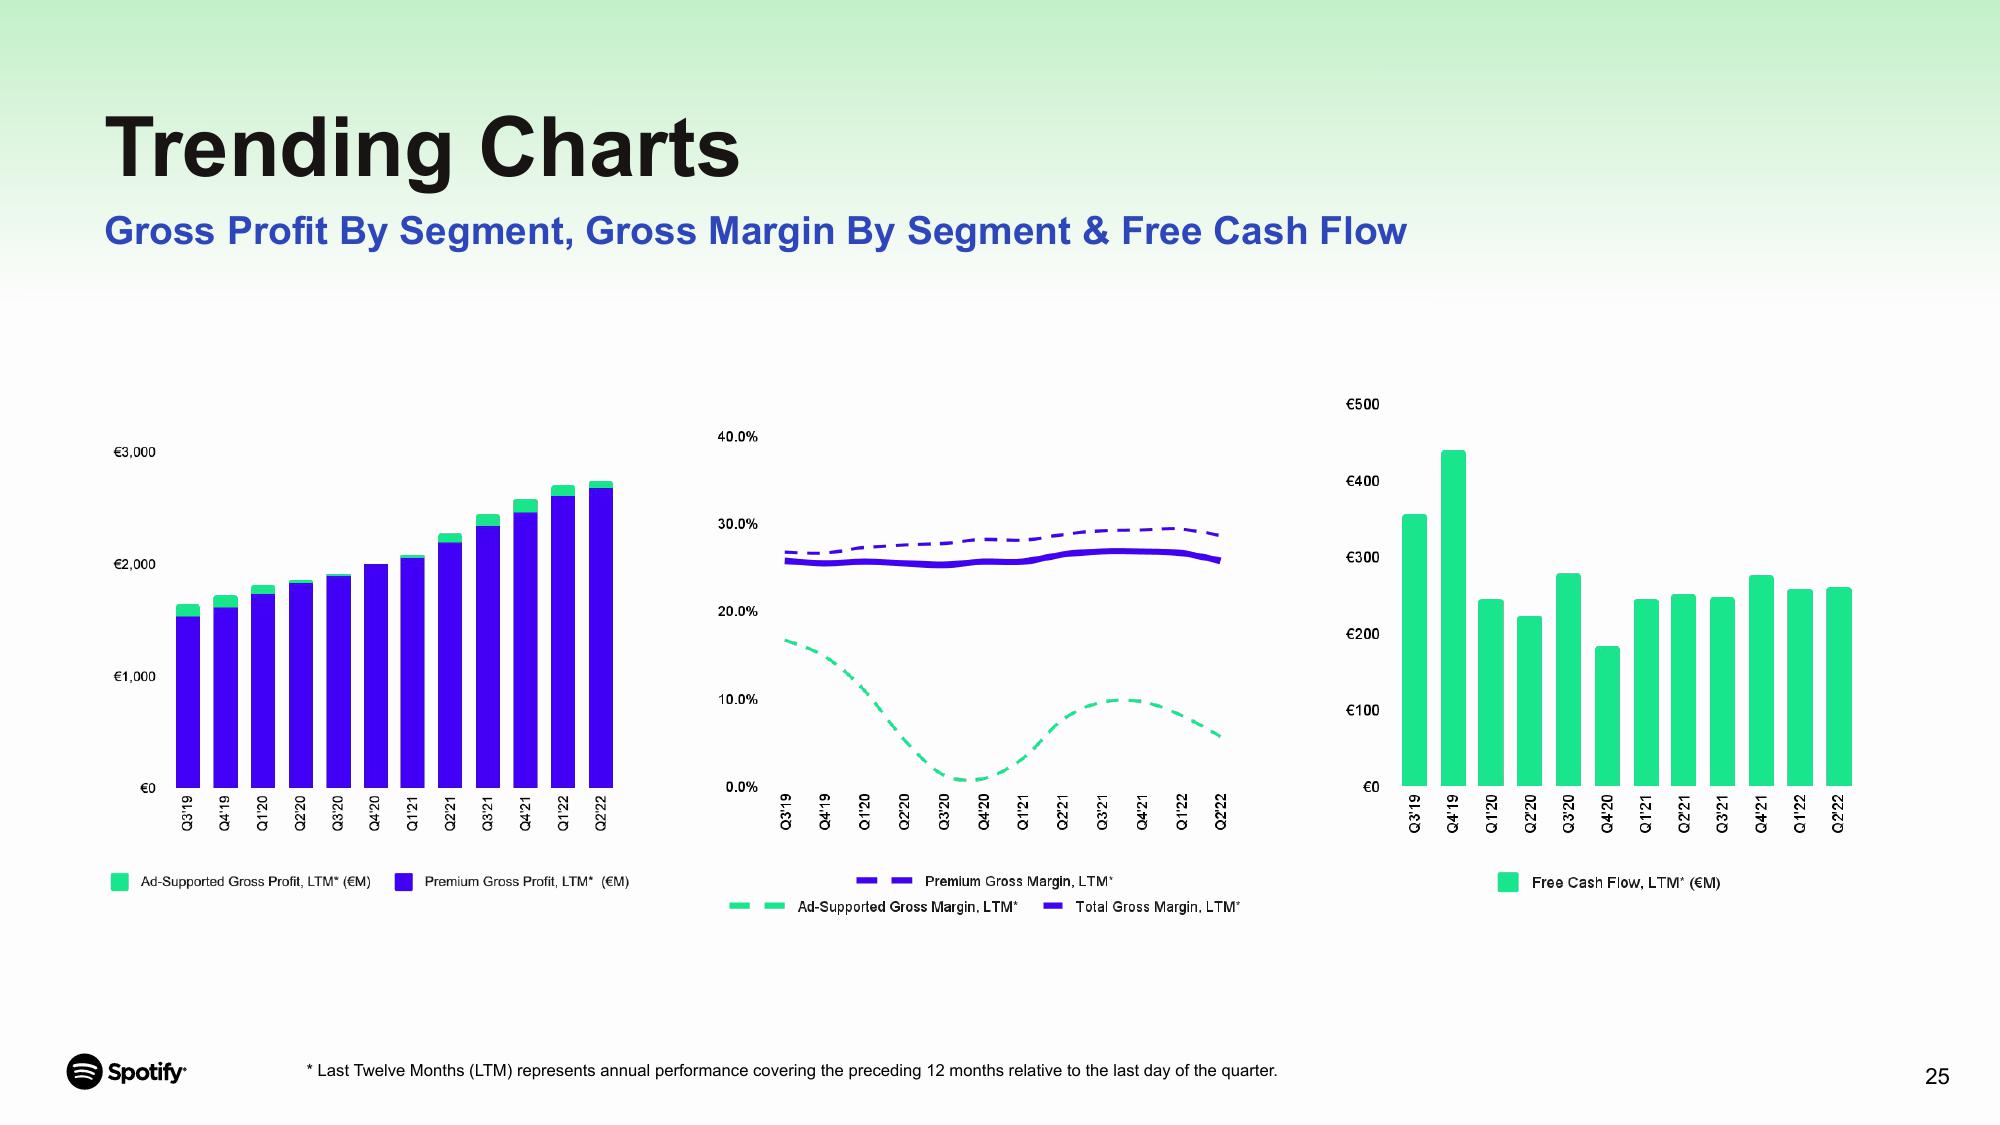
Trending Charts Gross Profit By Segment, Gross Margin By Segment & Free Cash Flow €3,000 €2,000 €1,000 €0 Q3'19 Q4'19 Spotify Q1'20 Q2¹20 Q3'20 Q4'20 Ad-Supported Gross Profit, LTM" (EM) Q1'21 Q2'21 Q3'21 Q4'21 Q1'22 Q2'22 Premium Gross Profit, LTM* (EM) 40.0% 30.0% 20.0% 10.0% 0.0% I Q3'19 I Q4'19 Q1'20 I Q2'20 Q3'20 Q4'20 Q1'21 Q2'21 Ad-Supported Gross Margin, LTM* Q3'21 Premium Gross Margin, LTM* Q4'21 Q1'22 Q2'22 Total Gross Margin, LTM* * Last Twelve Months (LTM) represents annual performance covering the preceding 12 months relative to the last day of the quarter. €500 €400 €300 €200 €100 €0 Q3'19 Q4'19 Q1'20 Q2'20 Q3'20 Q4'20 Q1'21 Q2'21 Q3'21 Free Cash Flow, LTM* (EM) Q4'21 Q1'22 Q2'22 25
View entire presentation