Payoneer SPAC Presentation Deck
Compelling Relative Valuation
2022 Revenue Growth Rate
EV/ Revenue Multiple(¹)
2021E
2022E
Selected Peers
Growth Adjusted EV / Revenue Multiple(¹)(2)
2021E
2022E
Payoneer
FTAC Olympus
25%
7.6 x
6.1 x
0.3 x
0.2 x
High-Growth Payments
P PayPal adyen
bill.com
Square
29%
36.5 x
27.7 x
1.2 x
1.0 x
e-Commerce
S shopify
BIGCOMMERCE
27%
49.3 x
38.5 x
1.9 x
1.5 x
Note: Revenue based on net revenue, which has been standardized across companies to remove network and interchange fees. Net revenue for Adyen, BigCommerce, Bill.com, FIS, and Global Payments are based on S&P CapitallQ. Net revenue for Paypal, Shopify, Square, and Fiserv are calculated by
averaging the estimates provided by sell-side research reports.
1. Based on CapitallQ prices as of February 1, 2021.
2.
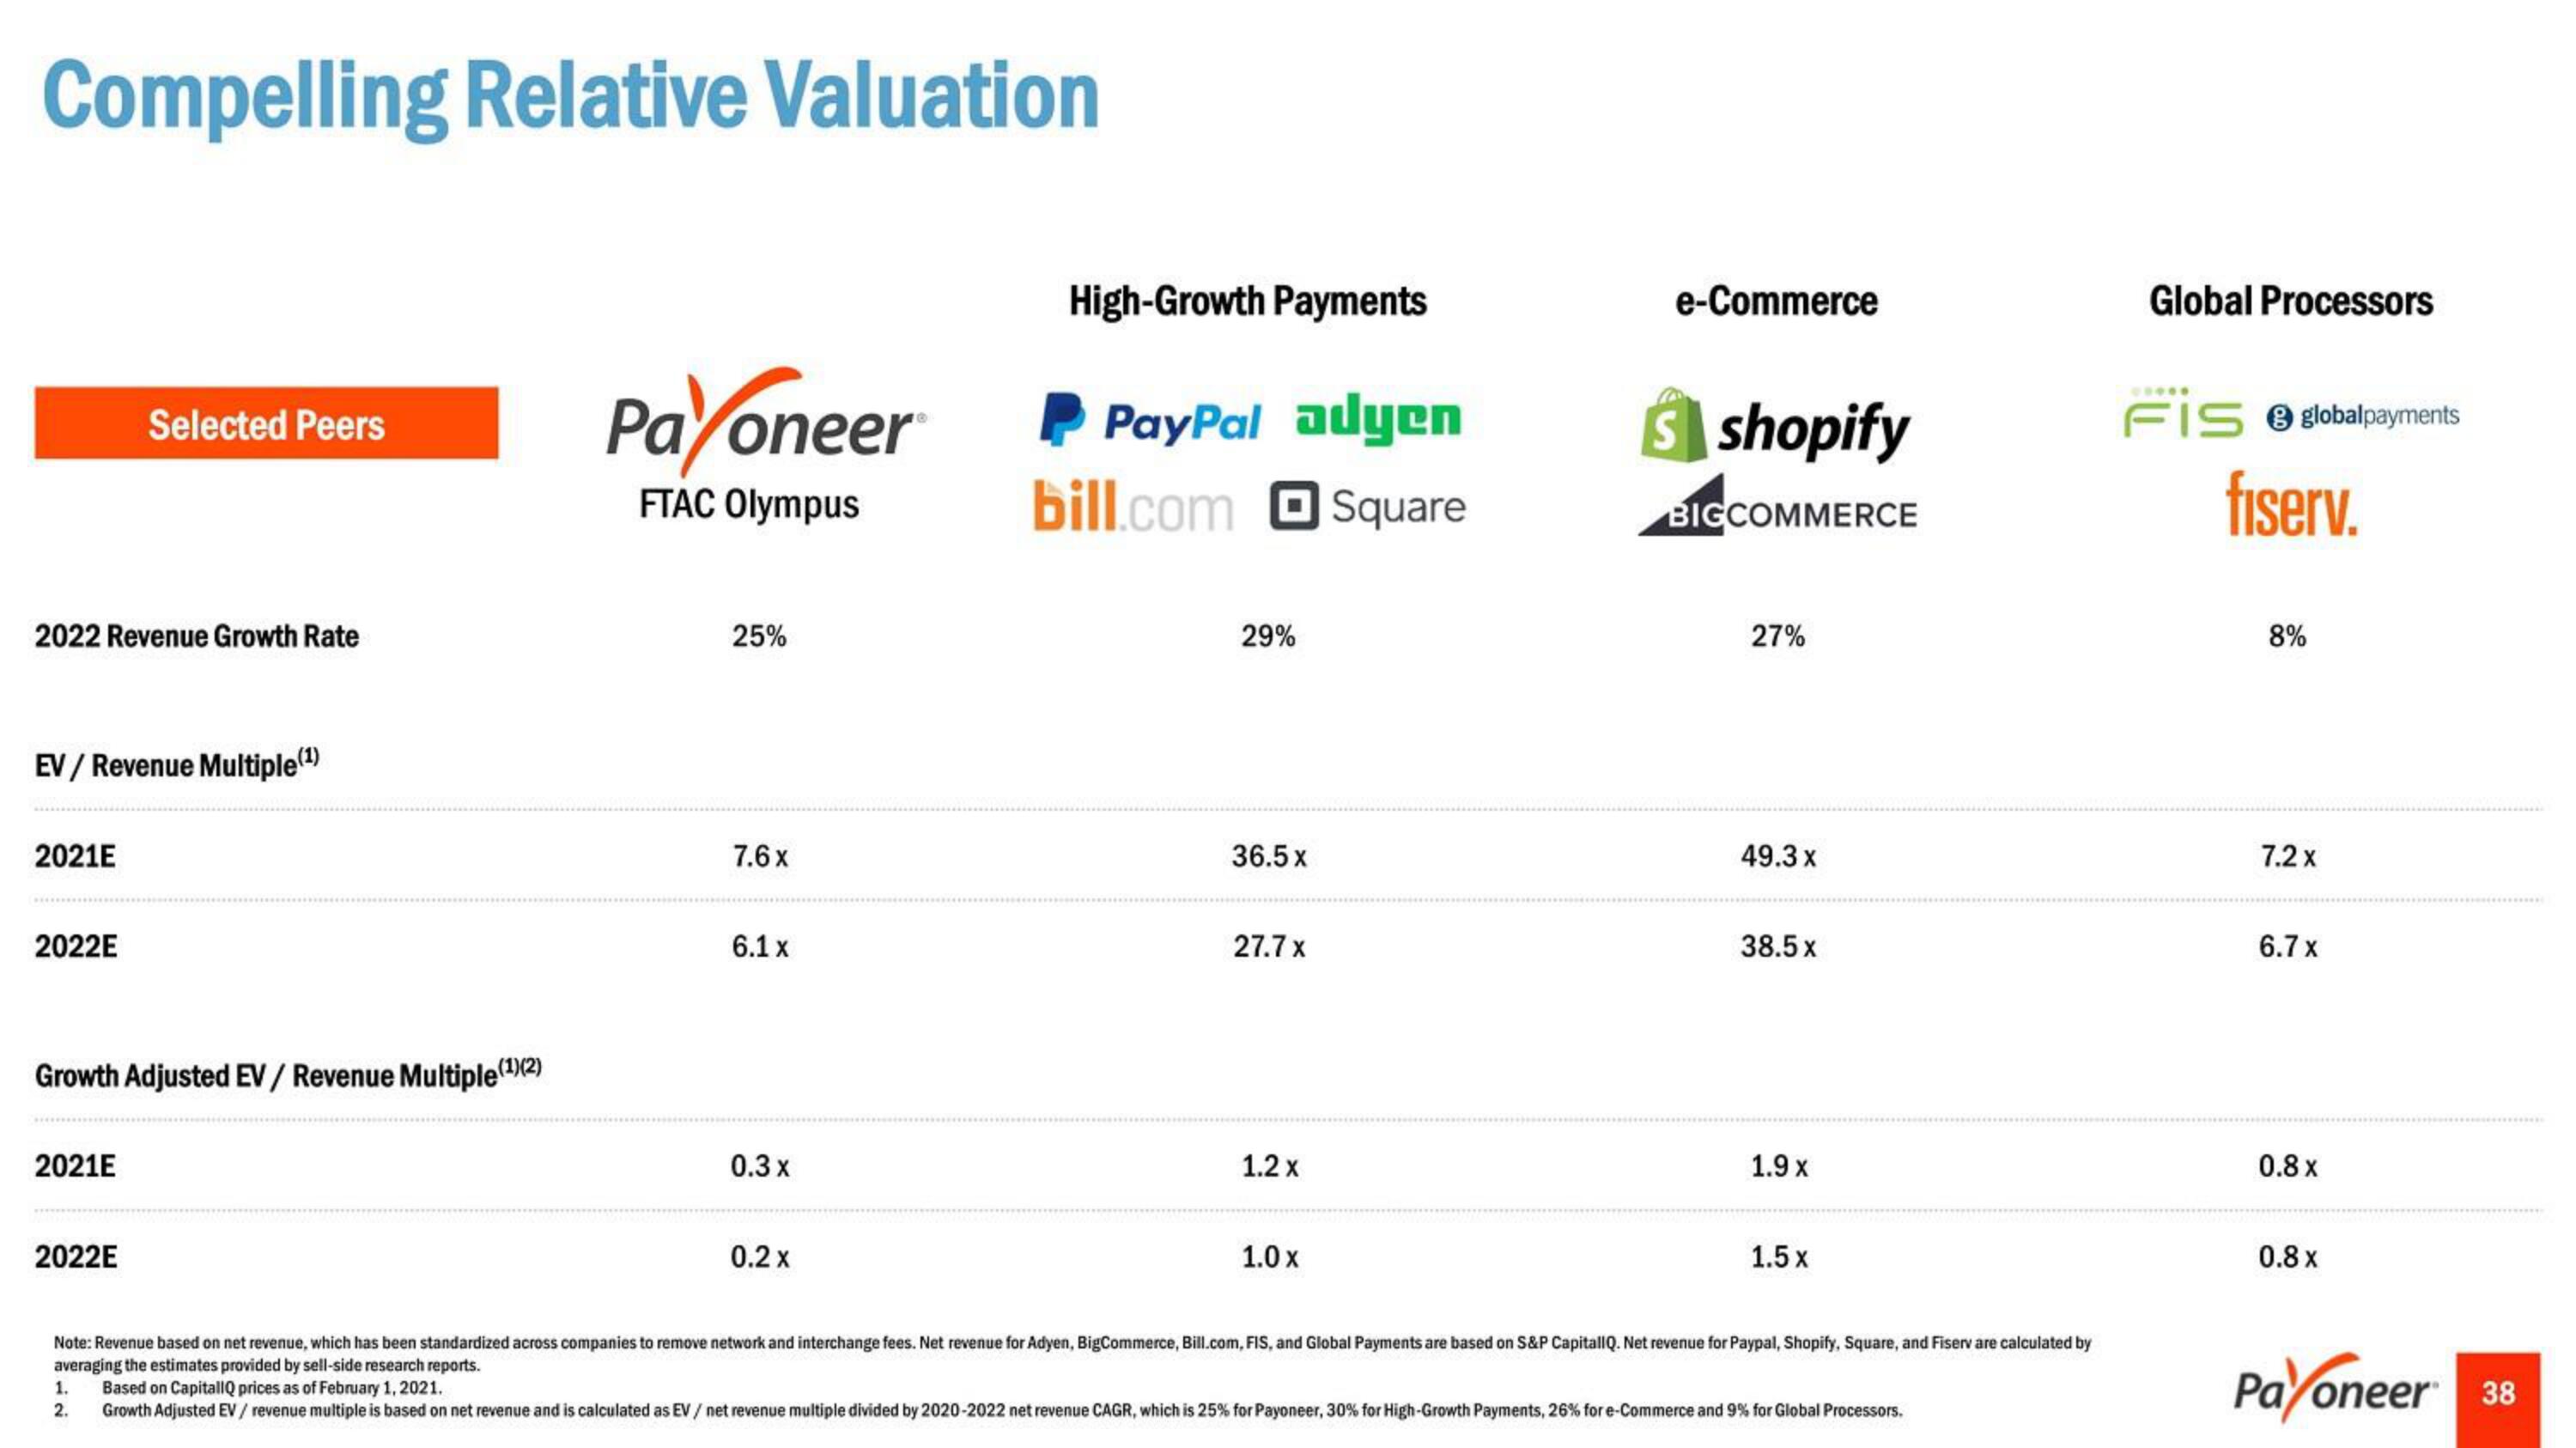
Growth Adjusted EV / revenue multiple is based on net revenue and is calculated as EV / net revenue multiple divided by 2020-2022 net revenue CAGR, which is 25% for Payoneer, 30% for High-Growth Payments, 26% for e-Commerce and 9% for Global Processors.
Global Processors
FIS & globalpayments
fiserv.
8%
7.2 x
6.7 x
0.8 x
0.8 x
oneer 38View entire presentation