AvePoint Investor Presentation Deck
25
($ in millions)
GAAP gross profit
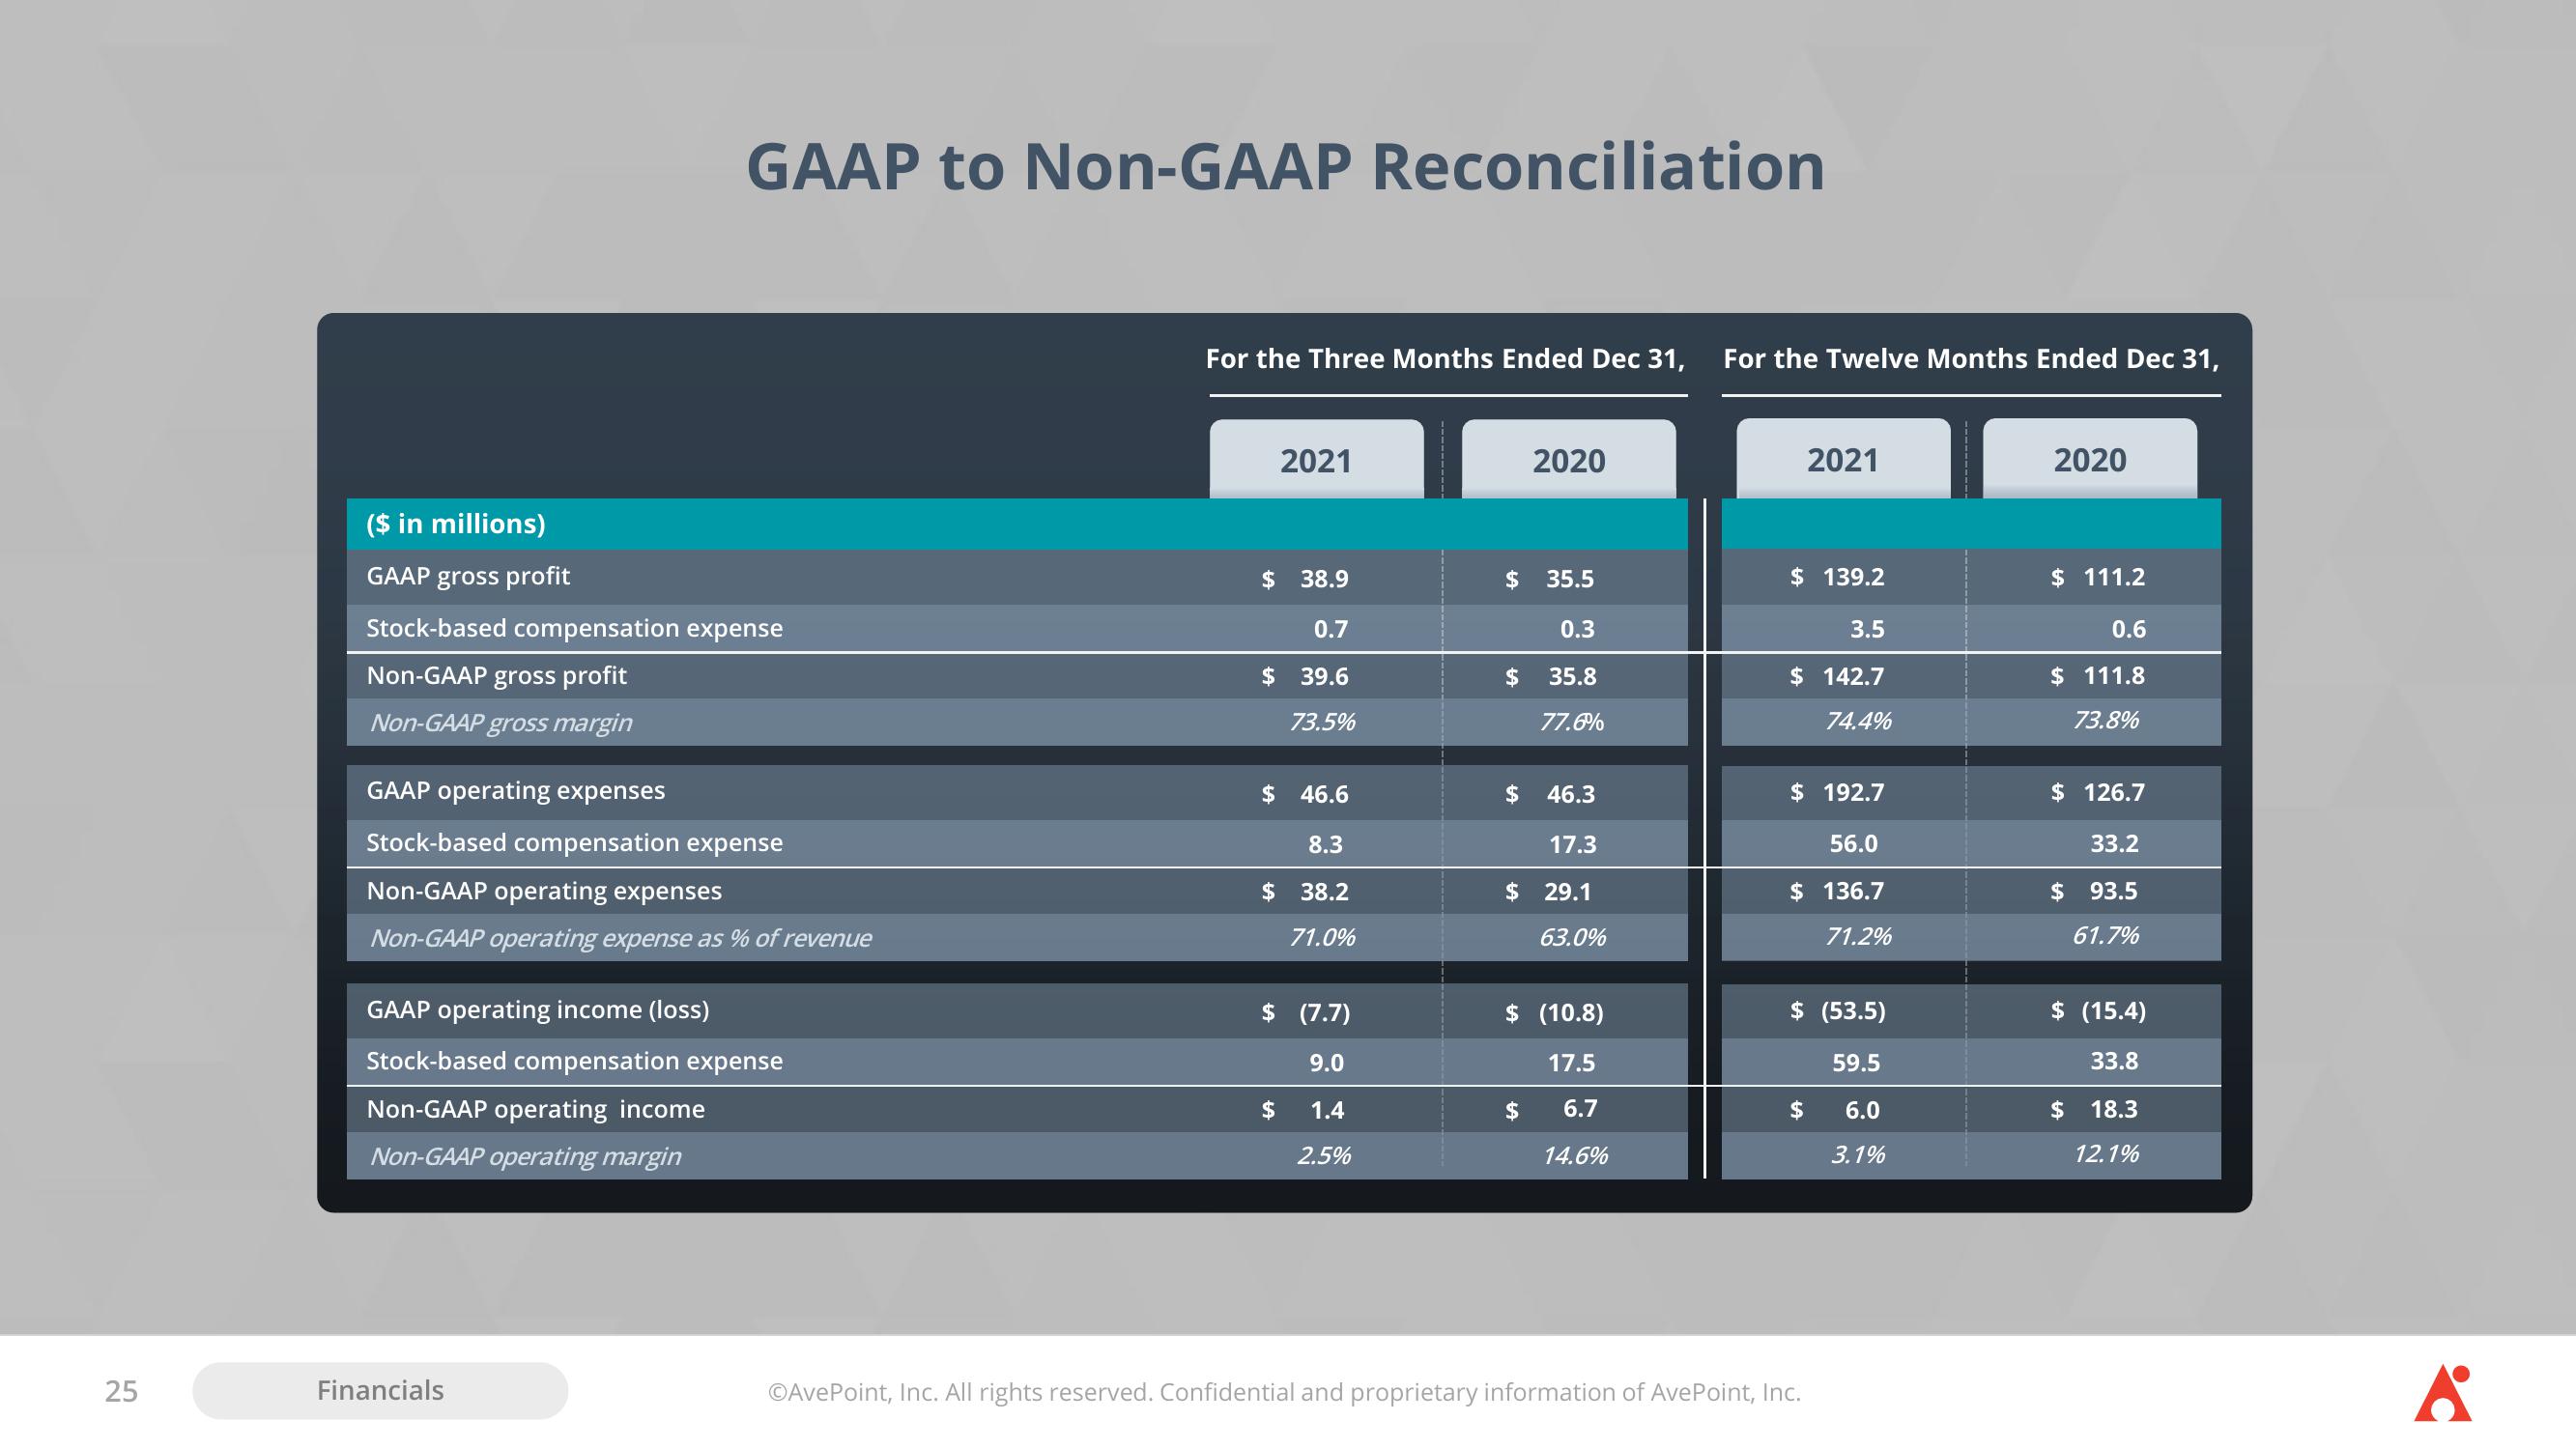
GAAP to Non-GAAP Reconciliation
Stock-based compensation expense
Non-GAAP gross profit
Non-GAAP gross margin
GAAP operating expenses
Stock-based compensation expense
Non-GAAP operating expenses
Non-GAAP operating expense as % of revenue
GAAP operating income (loss)
Stock-based compensation expense
Non-GAAP operating income
Non-GAAP operating margin
Financials
For the Three Months Ended Dec 31, For the Twelve Months Ended Dec 31,
2021
$38.9
0.7
$ 39.6
73.5%
$ 46.6
8.3
$ 38.2
71.0%
$ (7.7)
9.0
1.4
2.5%
$
$35.5
$
2020
$
0.3
35.8
77.6%
46.3
$ 29.1
63.0%
$ (10.8)
17.5
6.7
14.6%
2021
$ 139.2
3.5
$ 142.7
74.4%
$ 192.7
56.0
$ 136.7
71.2%
$ (53.5)
59.5
$ 6.0
3.1%
ⒸAvePoint, Inc. All rights reserved. Confidential and proprietary information of AvePoint, Inc.
2020
$ 111.2
0.6
$ 111.8
73.8%
$ 126.7
33.2
$93.5
61.7%
$ (15.4)
33.8
18.3
12.1%
$
6View entire presentation