Selina SPAC
Our Portfolio Mix Shift and Technology Investment Creates A Highly
Visible Path to Increased Revenue per Bed
Ramp of fully mature beds (24+ months), 2019A - 2025E
~$15,000
2019A
Developed
Market Revenue
per Bed
% Mature²
% Developed
Projection for Full Portfolio
Selina
‒‒‒‒‒‒‒‒‒‒‒‒‒‒‒‒‒‒‒‒‒‒‒
N
$ 9,000
2019A Revenue
per Bed
38%
5%
22%
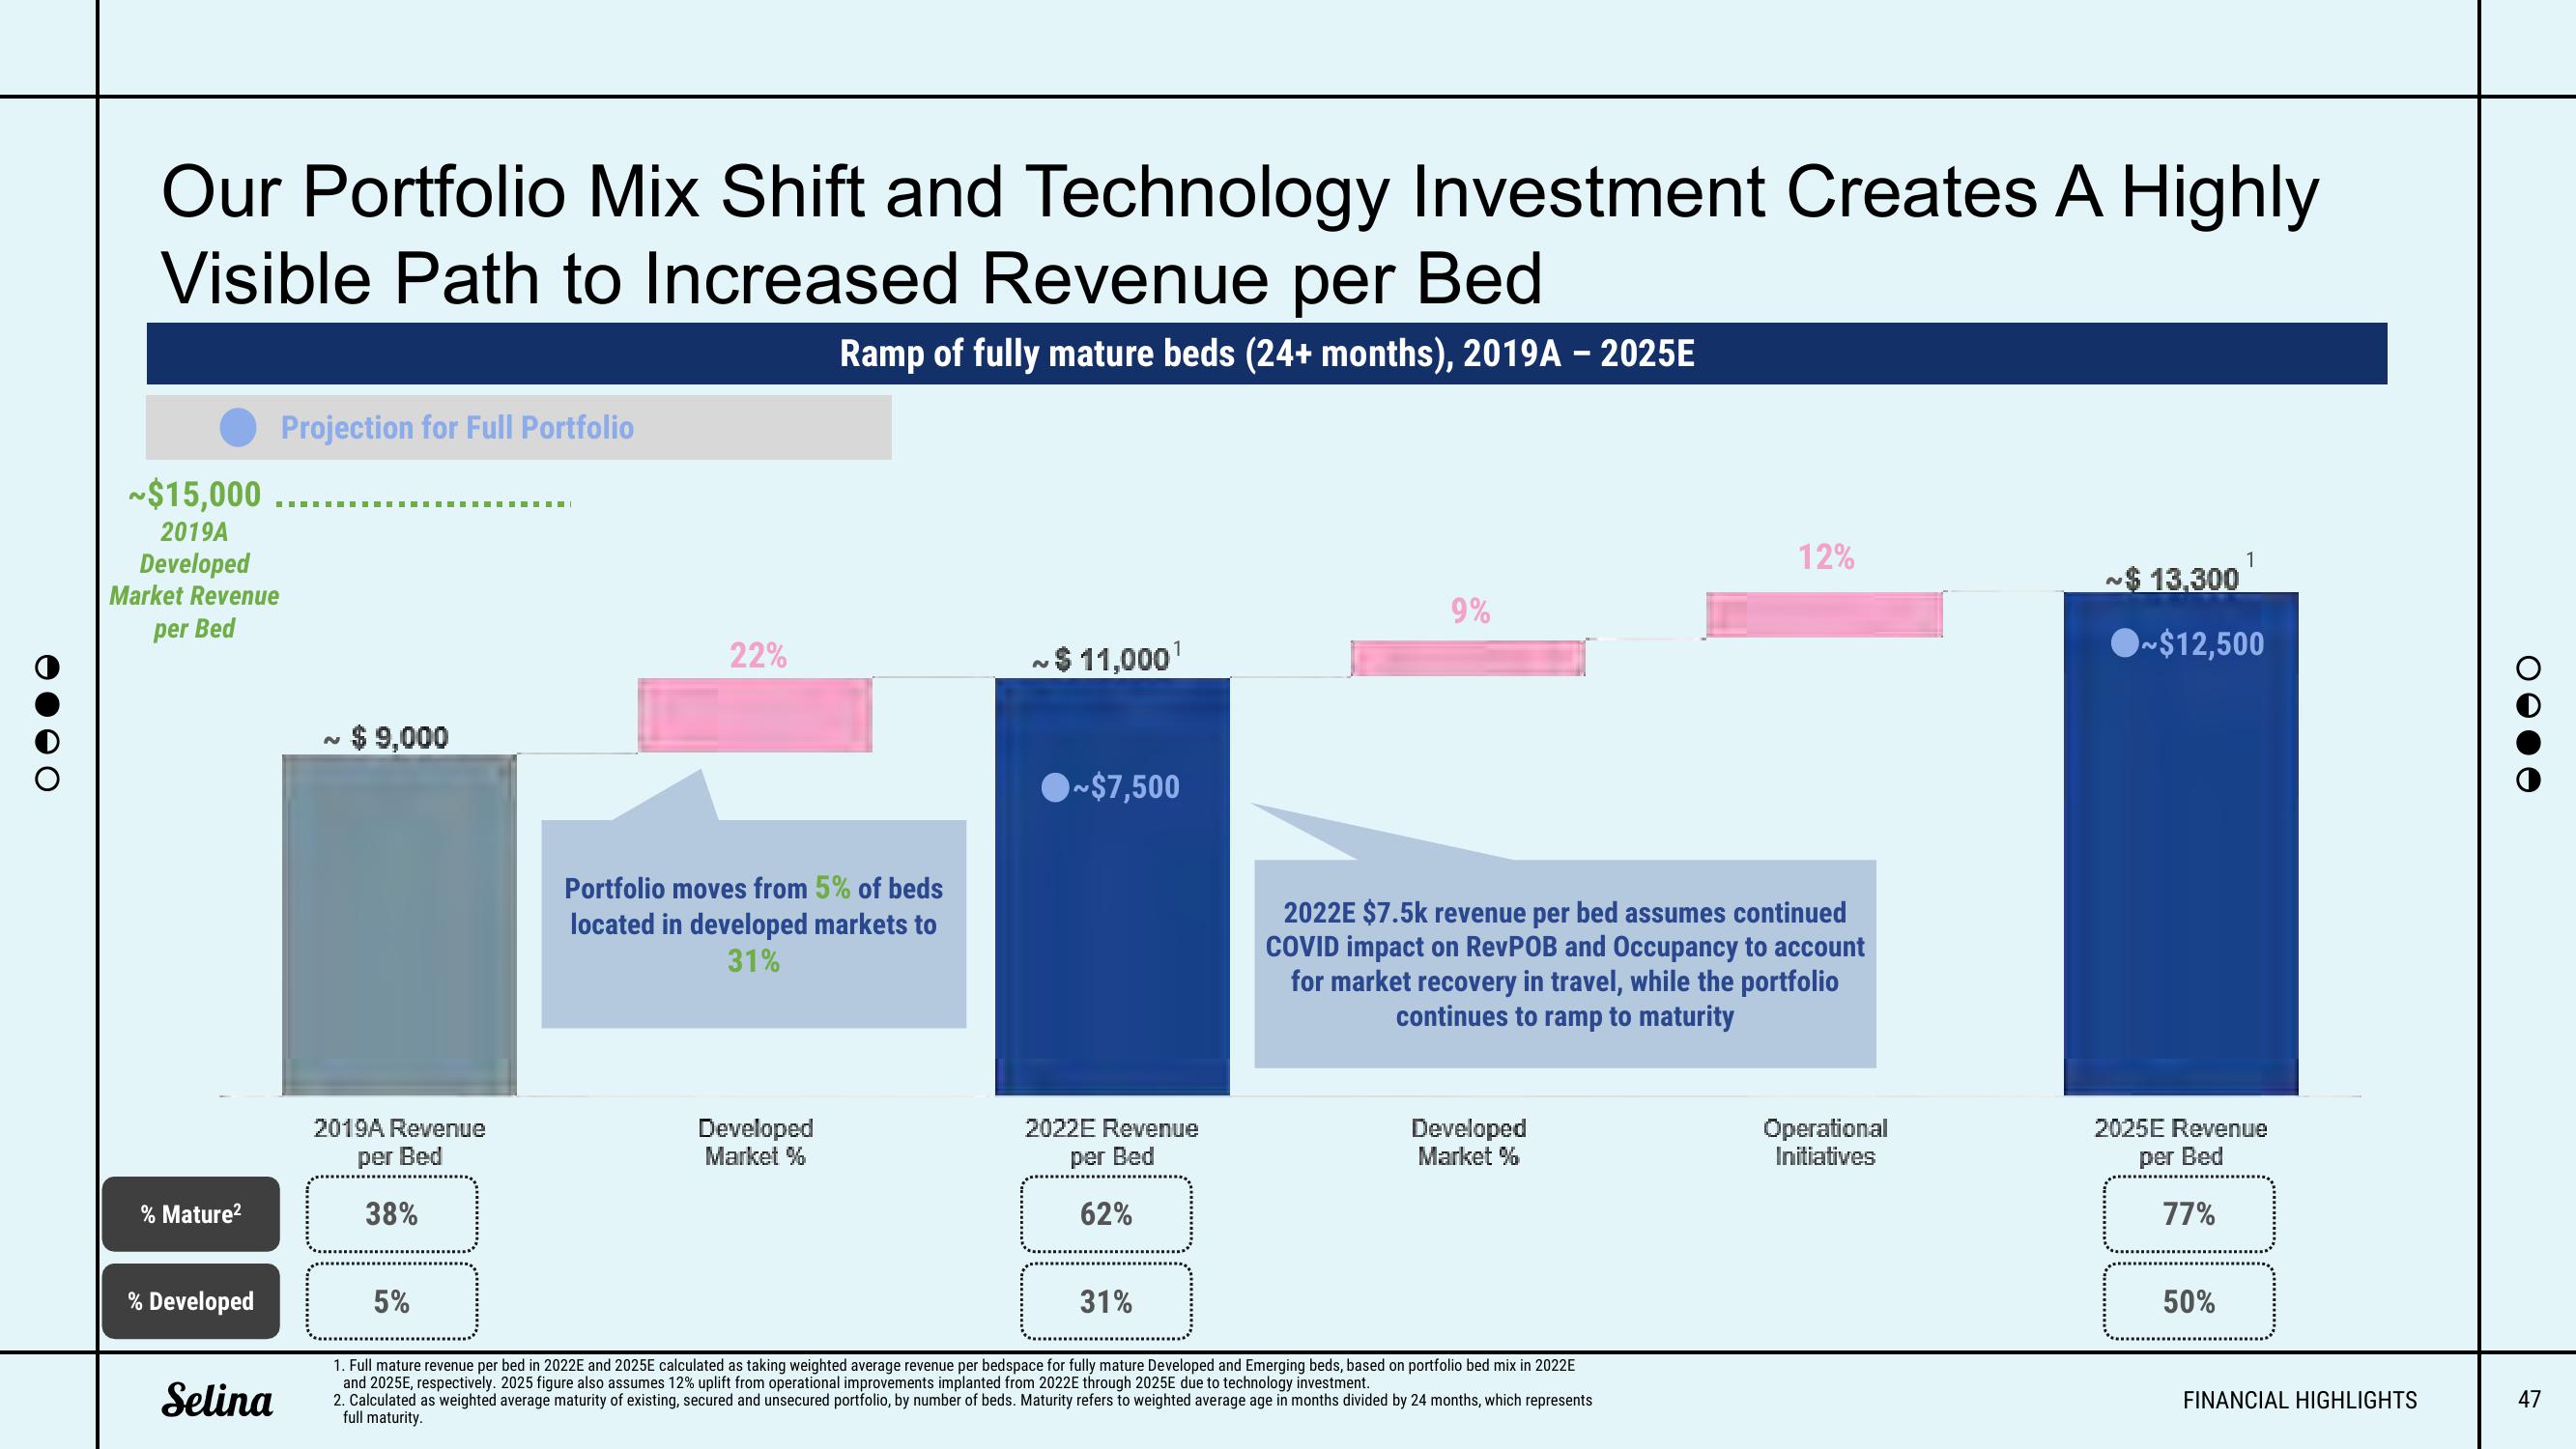
Portfolio moves from 5% of beds
located in developed markets to
31%
Developed
Market %
N
$ 11,000¹
~$7,500
2022E Revenue
per Bed
62%
31%
9%
2022E $7.5k revenue per bed assumes continued
COVID impact on RevPOB and Occupancy to account
for market recovery in travel, while the portfolio
continues to ramp to maturity
Developed
Market %
12%
1. Full mature revenue per bed in 2022E and 2025E calculated as taking weighted average revenue per bedspace for fully mature Developed and Emerging beds, based on portfolio bed mix in 2022E
and 2025E, respectively. 2025 figure also assumes 12% uplift from operational improvements implanted from 2022E through 2025E due to technology investment.
2. Calculated as weighted average maturity of existing, secured and unsecured portfolio, by number of beds. Maturity refers to weighted average age in months divided by 24 months, which represents
full maturity.
Operational
Initiatives
1
$ 13.300
~$12,500
2025E Revenue
per Bed
77%
50%
FINANCIAL HIGHLIGHTS
47View entire presentation