XP Inc Results Presentation Deck
Adjusted EBITDA and Adjusted Net Income
Operational Leverage despite investments in technology, client experience and product offering
Adjusted EBITDA¹ (in R$ mn)
Other Operating Income, Net
% Adj EBITDA
Margin
Headcount
1,043
18
■
1,025
1Q21
39.7%
3,973
+14%
1,390
233
1,157
4Q21
42.7%
6,193
1,191
1,191
1Q22
38.2%
6,323
Highlights
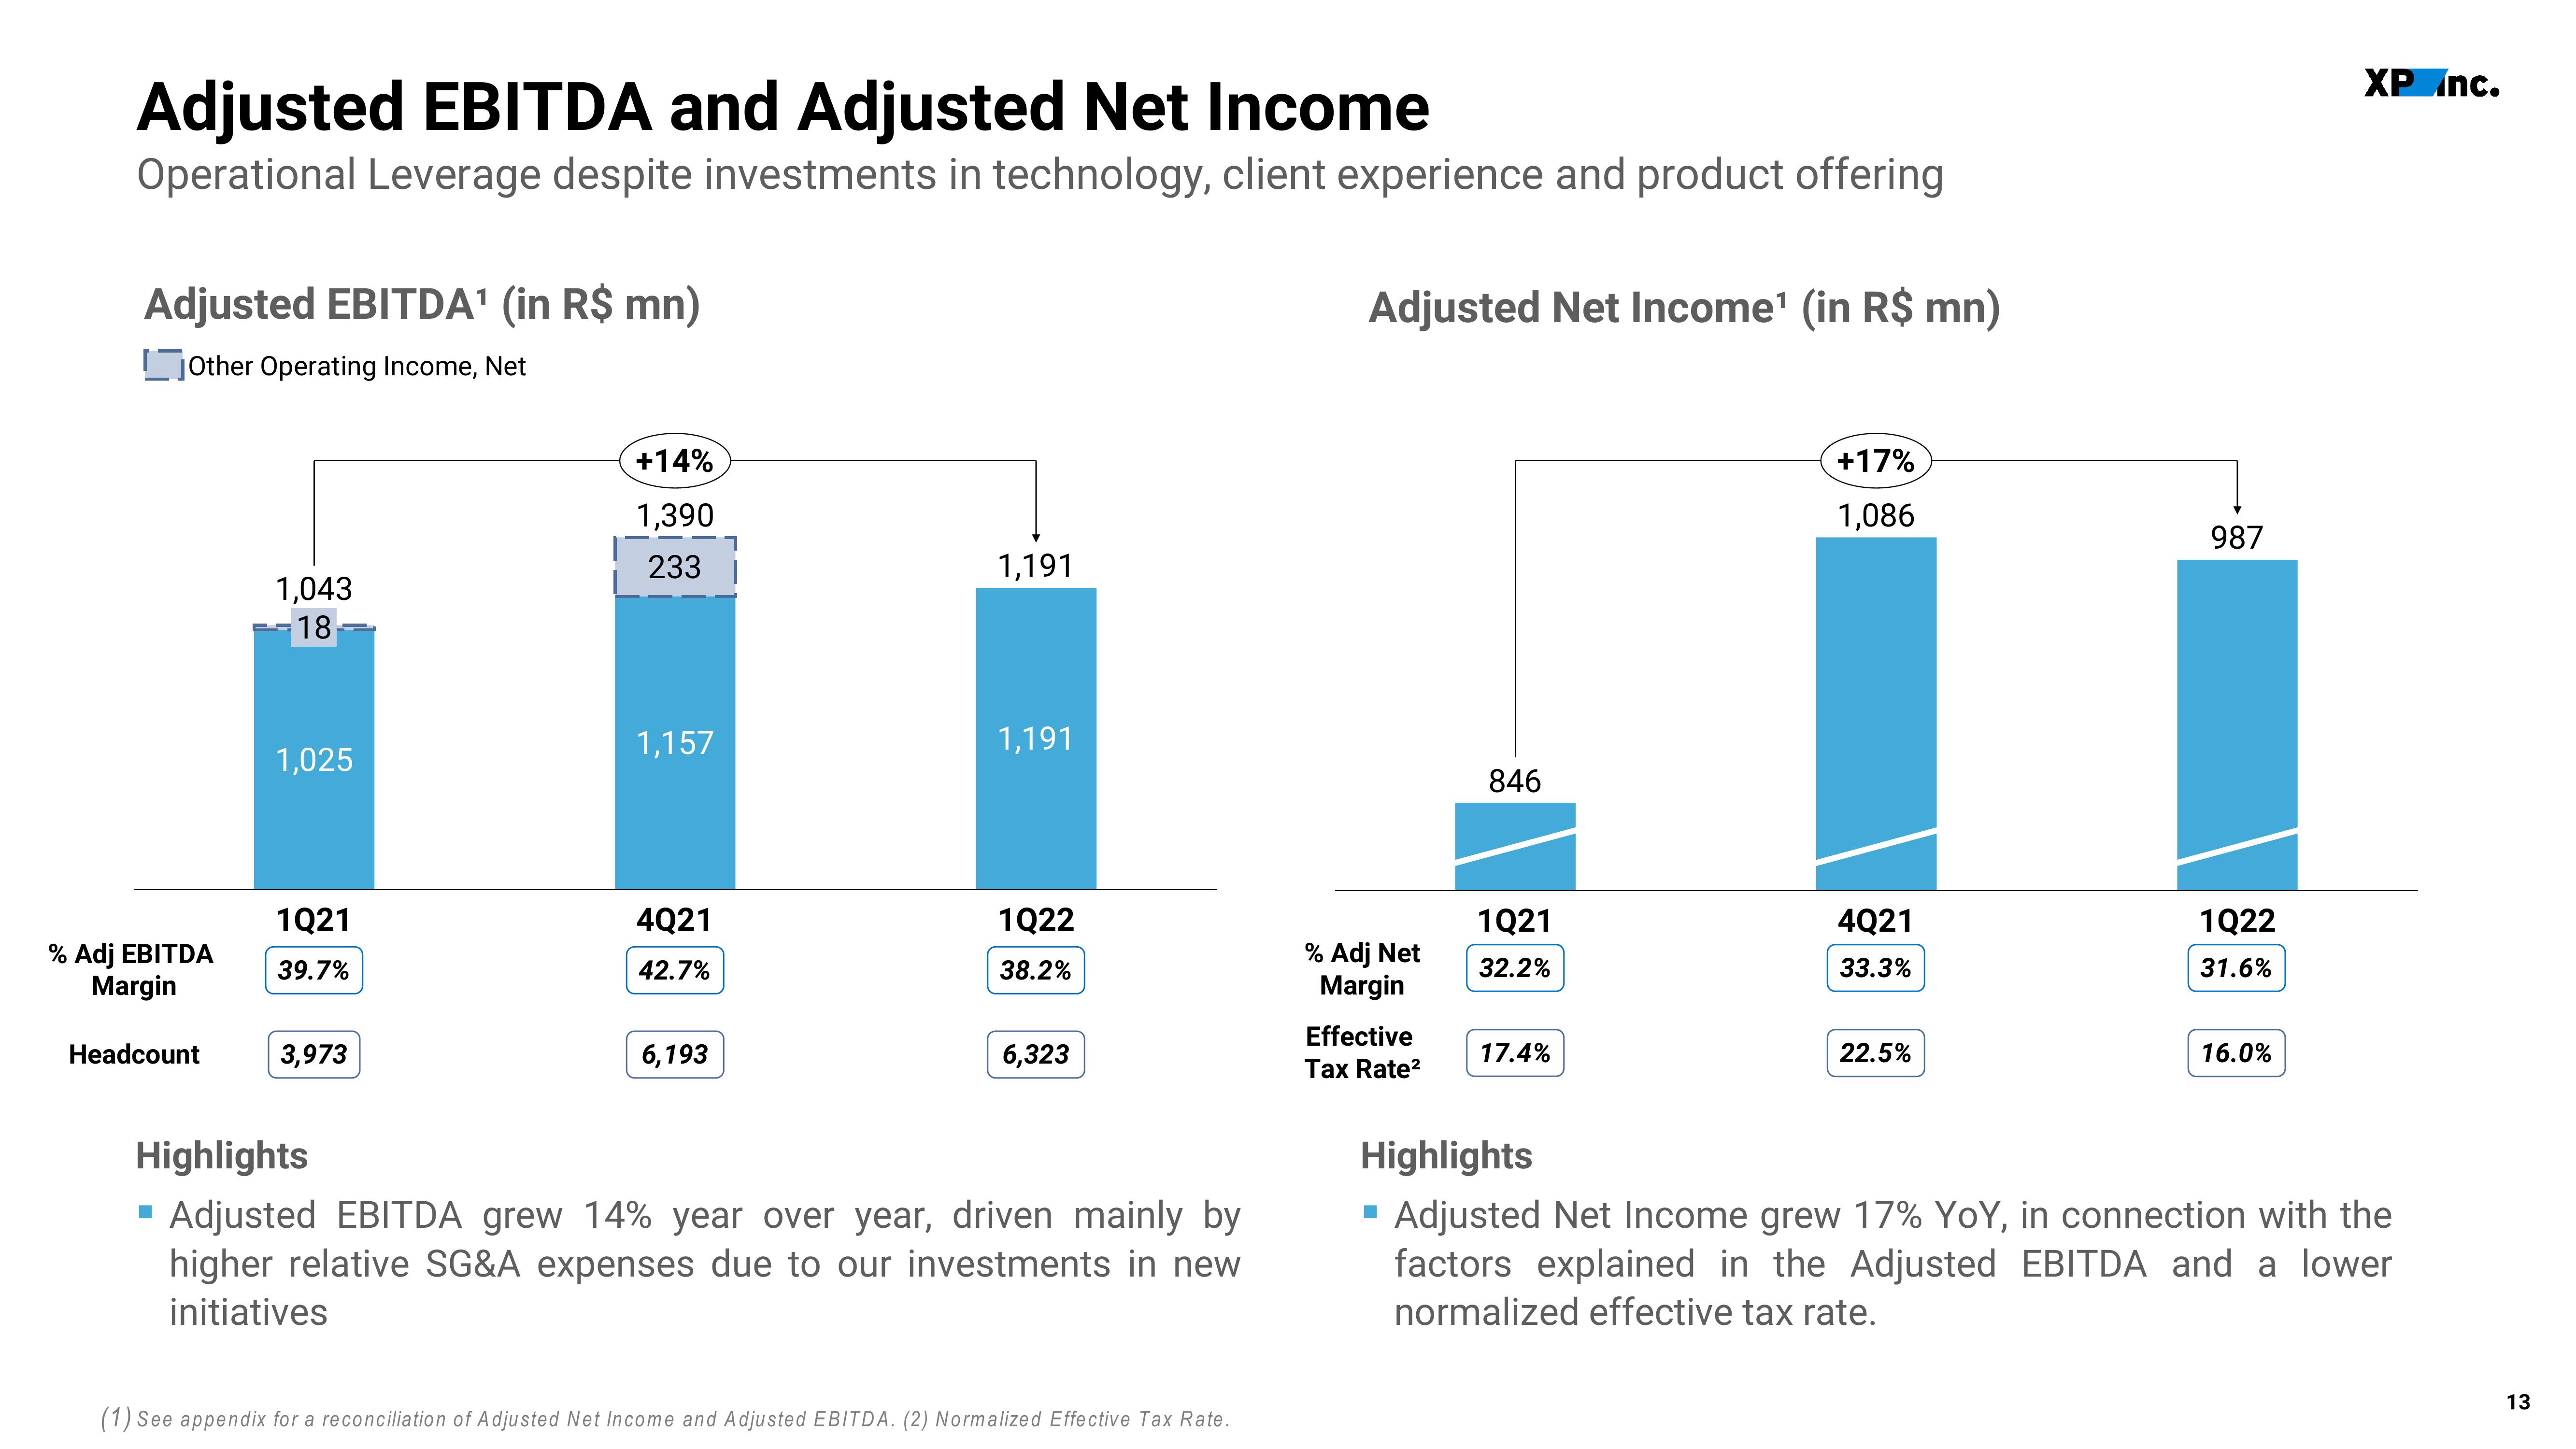
Adjusted EBITDA grew 14% year over year, driven mainly by
higher relative SG&A expenses due to our investments in new
initiatives
(1) See appendix for a reconciliation of Adjusted Net Income and Adjusted EBITDA. (2) Normalized Effective Tax Rate.
Adjusted Net Income¹ (in R$ mn)
% Adj Net
Margin
Effective
Tax Rate²
846
■
1Q21
32.2%
17.4%
+17%
1,086
4Q21
33.3%
22.5%
987
1Q22
31.6%
16.0%
XP Inc.
Highlights
Adjusted Net Income grew 17% YoY, in connection with the
factors explained in the Adjusted EBITDA and a lower
normalized effective tax rate.
13View entire presentation