Rocket Lab SPAC Presentation Deck
FINANCIAL MODEL SUMMARY
36
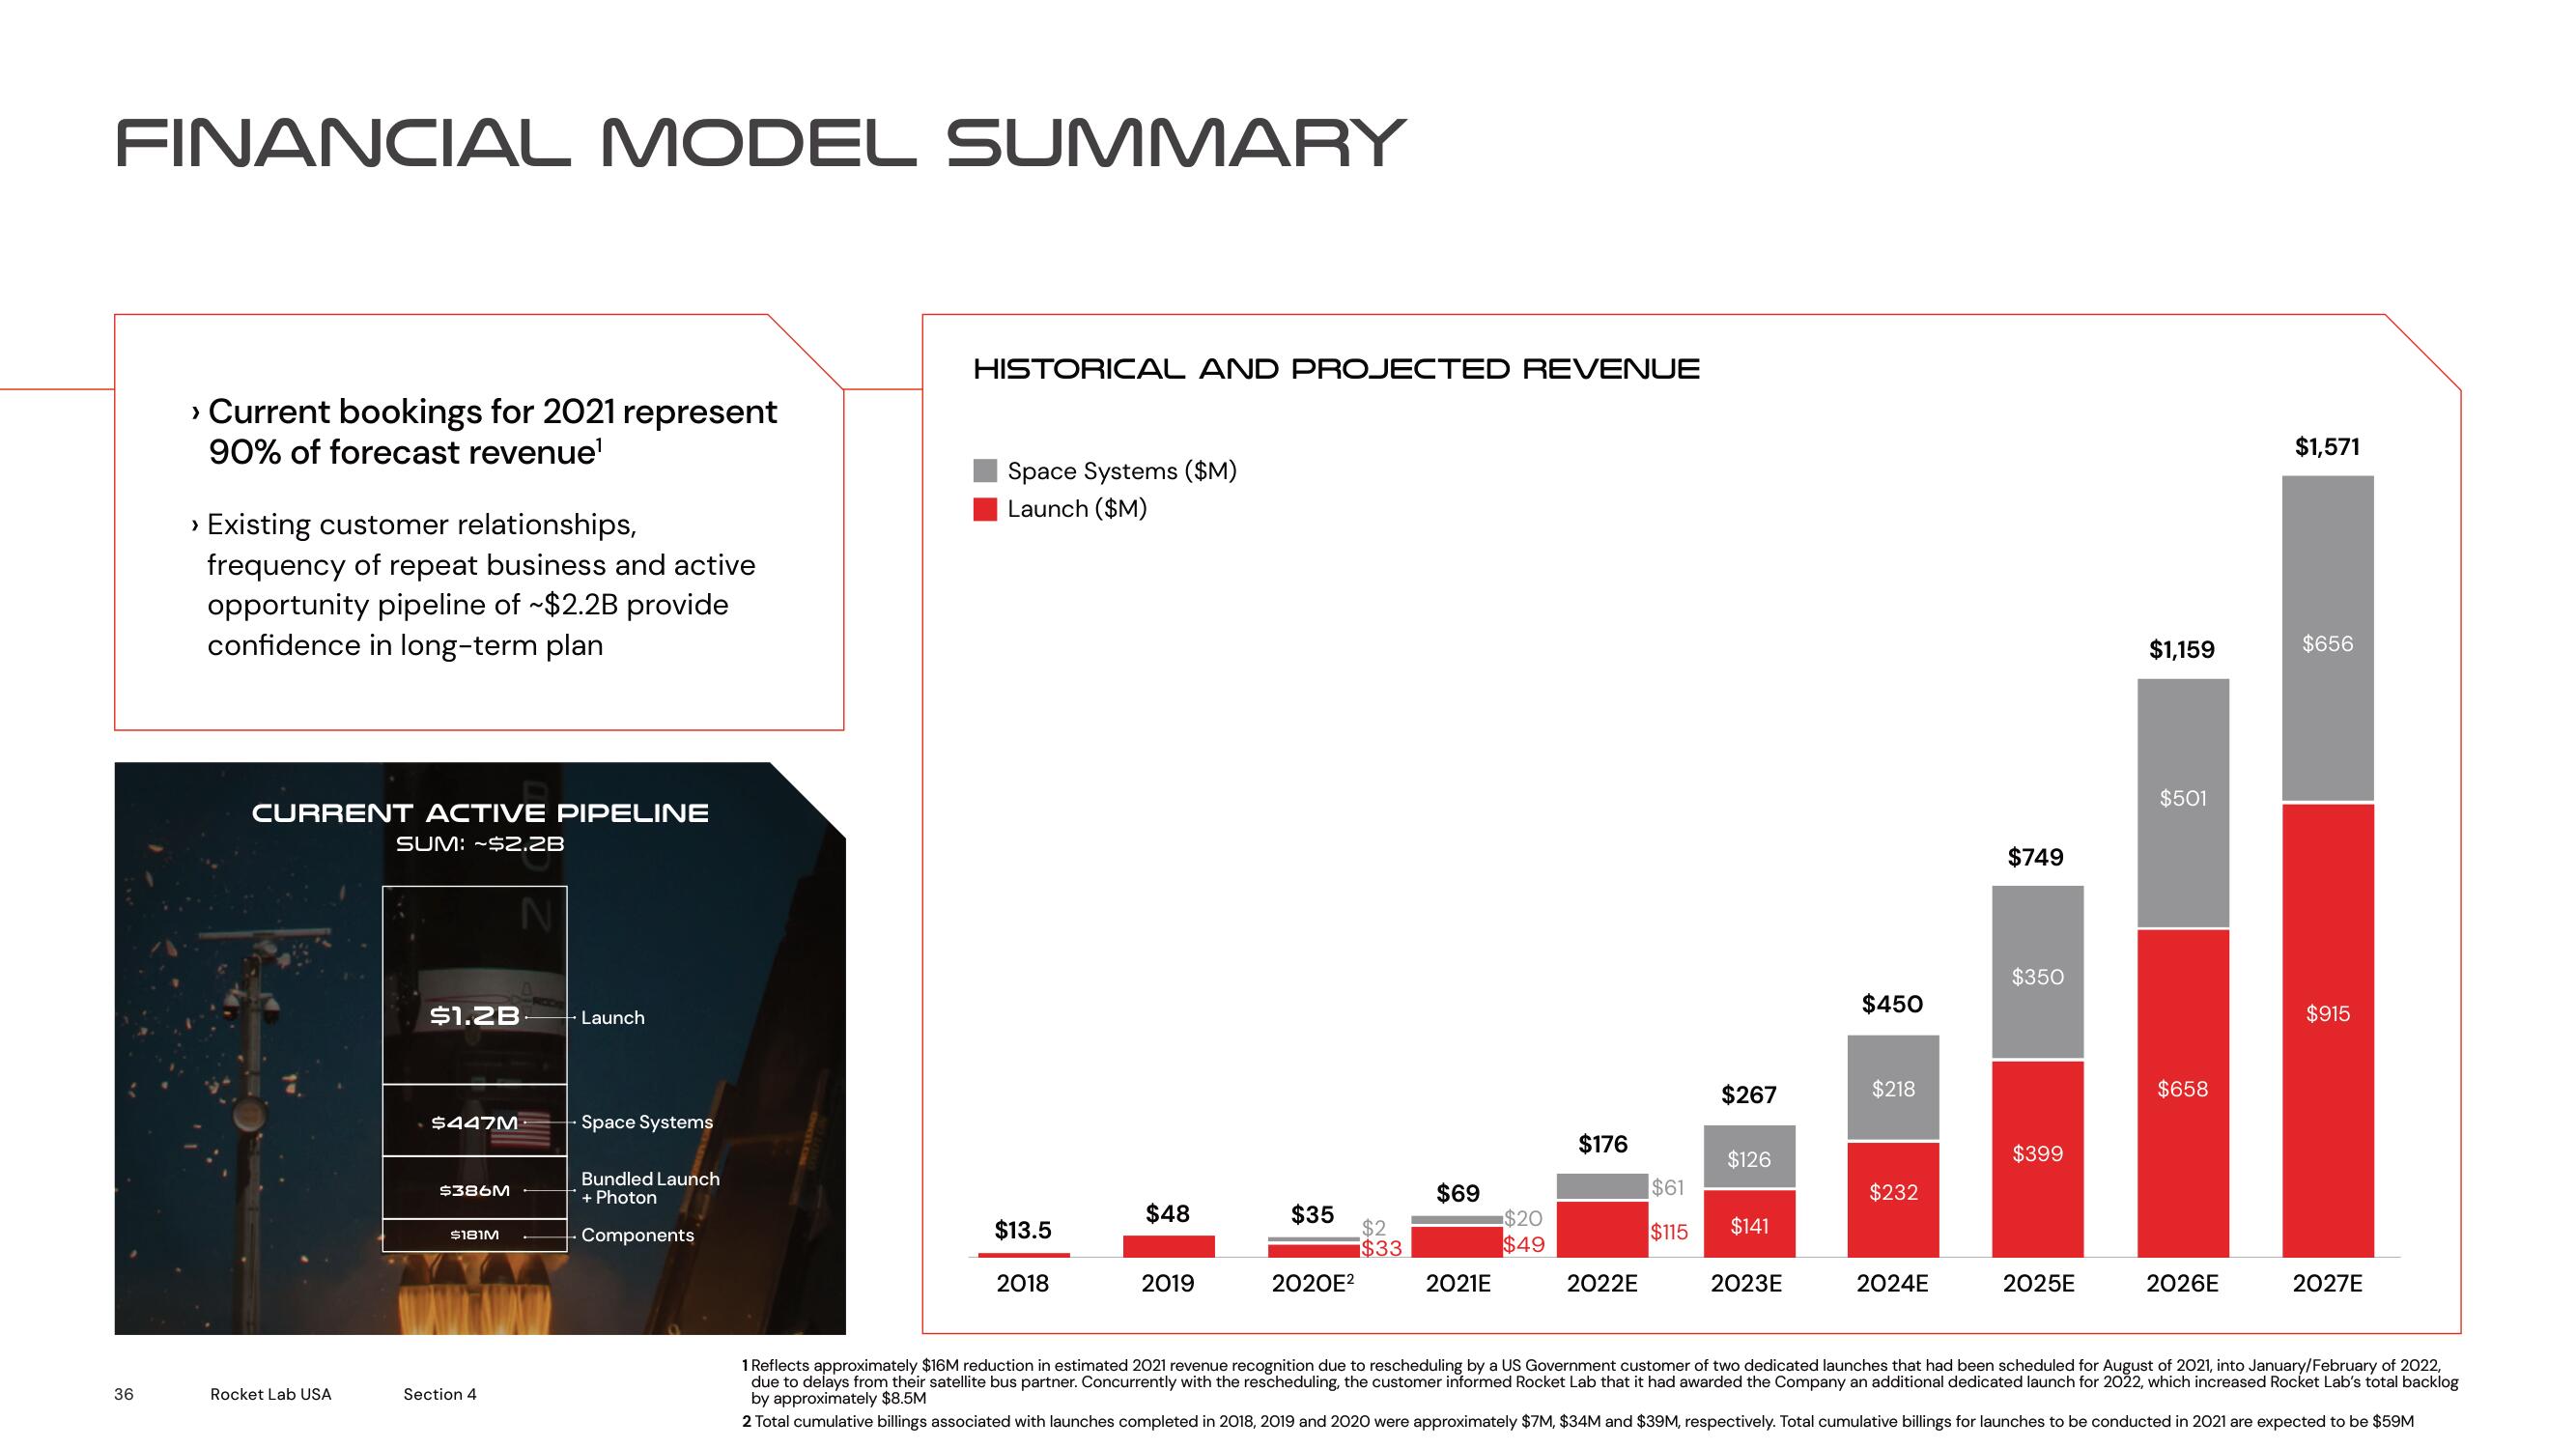
› Current bookings for 2021 represent
90% of forecast revenue¹
› Existing customer relationships,
frequency of repeat business and active
opportunity pipeline of ~$2.2B provide
confidence in long-term plan
CURRENT ACTIVE PIPELINE
SUM: -$2.2B
N
Rocket Lab USA
$1.2B
$447M
$386M
$181M
Section 4
+Launch
Space Systems
Bundled Launch
+ Photon
Components
HISTORICAL AND PROJECTED REVENUE
Space Systems ($M)
Launch ($M)
$13.5
2018
$48
2019
$35
2020E²
$2
$33
$69
2021E
$20
$49
$176
2022E
$61
$115
$267
$126
$141
2023E
$450
$218
$232
2024E
$749
$350
$399
2025E
$1,159
$501
$658
2026E
$1,571
$656
$915
2027E
1 Reflects approximately $16M reduction in estimated 2021 revenue recognition due to rescheduling by a US Government customer of two dedicated launches that had been scheduled for August of 2021, into January/February of 2022,
due to delays from their satellite bus partner. Concurrently with the rescheduling, the customer informed Rocket Lab that it had awarded the Company an additional dedicated launch for 2022, which increased Rocket Lab's total backlog
by approximately $8.5M
2 Total cumulative billings associated with launches completed in 2018, 2019 and 2020 were approximately $7M, $34M and $39M, respectively. Total cumulative billings for launches to be conducted in 2021 are expected to be $59MView entire presentation