Dutch Bros Results Presentation Deck
SUMMARY QUARTERLY DATA
($ in millions; except Shop Count)
Company-Operated Shop Count
Total Shop Count
Company-Operated Shop Revenue
Total Revenue
Company-operated Shop Gross Margin
Company-operated Shop Depreciation & Amortization
2
Company-Operated Shop Contribution ²
Adjusted EBITDA
Net Income (Loss)
2
($ in millions)
Company-operated Shop Gross Margin
Company-Operated Shop Contribution ²
$
$
$
$
$
Adjusted EBITDA
Net Income
Q1
191
453
77.9 $
98.8 $
17.6 $
3.3 $
20.8 $
18.7 $
(4.8) $
Q2
$
$
$
$
2021 1
207
471
103.0 $
129.2 $
29.5 $
3.5 $
32.9 $
30.7 $
11.9 $
Q1
Q3
0.4 $
0.4 $
0.8 $
0.8 $
241
503
108.7 $
129.8 $
23.1 $
4.3 $
27.4 $
21.0 $
(116.8) $
Q2
2021 1
Q4
0.4 $
0.4 $
0.4 $
0.4 $
271
538
114.2 $
140.1 $
16.6 $
5.3 $
21.8 $
13.8 $
(8.2) $
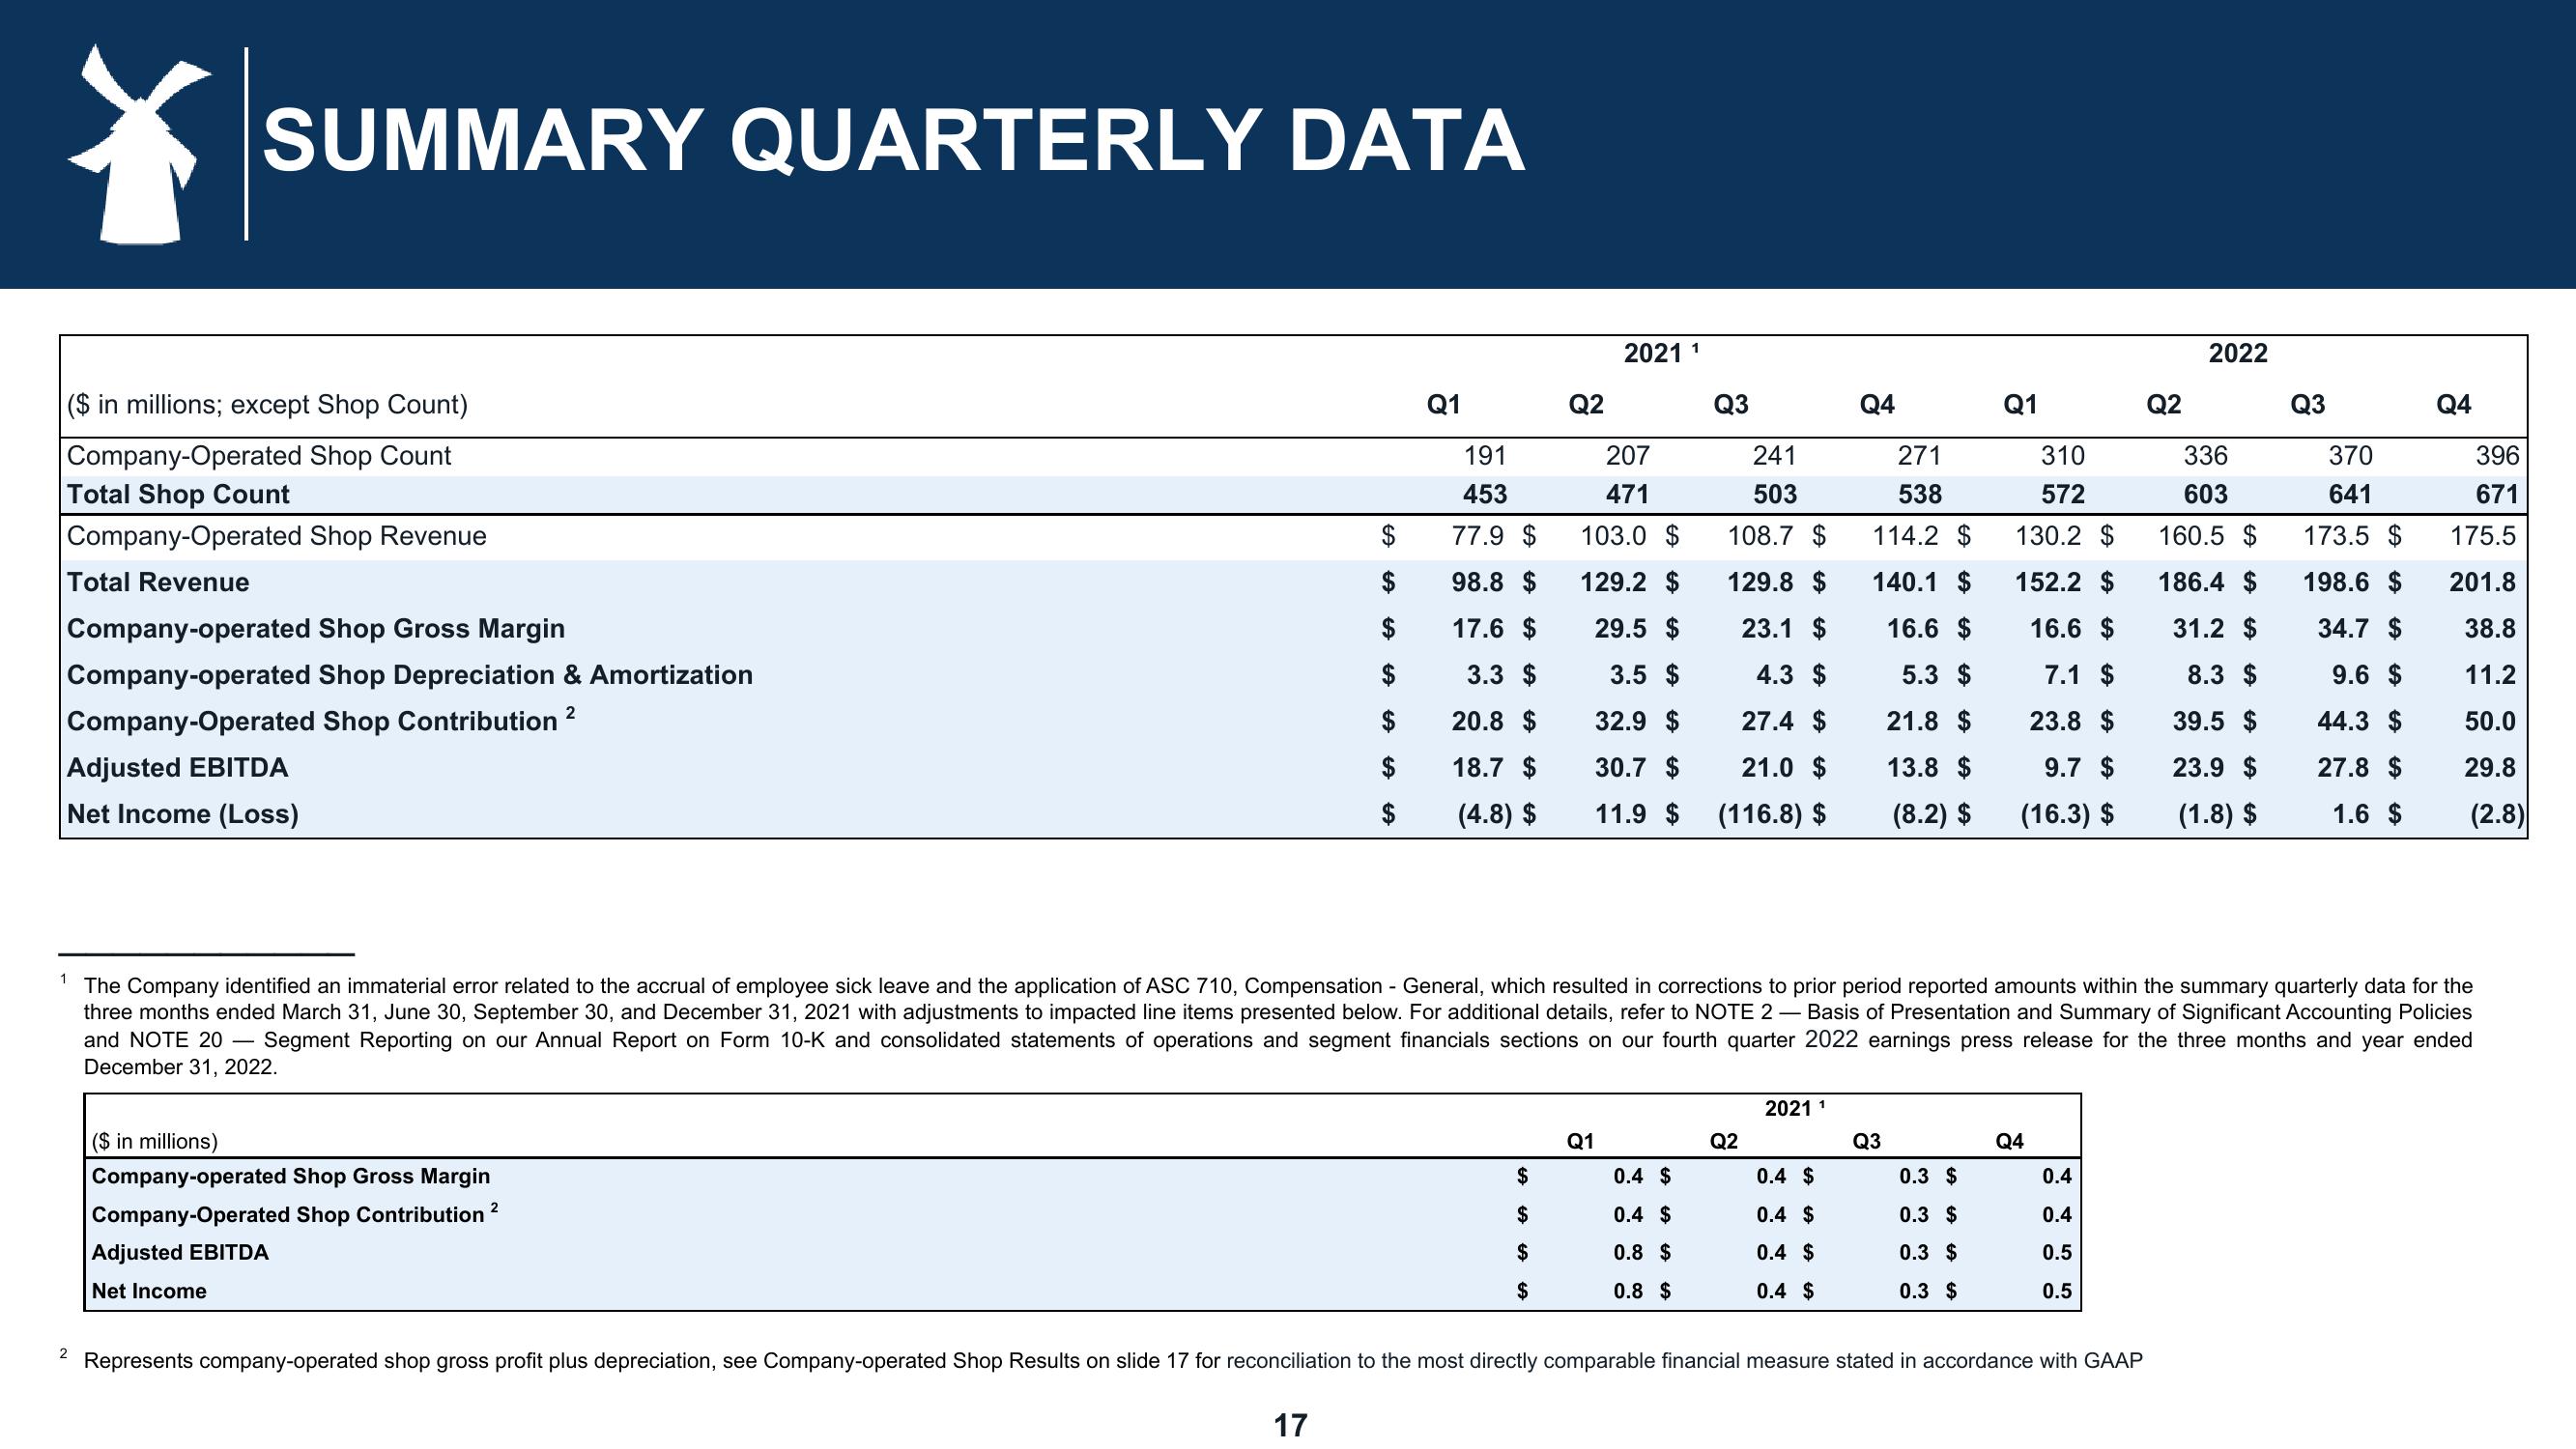
1 The Company identified an immaterial error related to the accrual of employee sick leave and the application of ASC 710, Compensation - General, which resulted in corrections to prior period reported amounts within the summary quarterly data for the
three months ended March 31, June 30, September 30, and December 31, 2021 with adjustments to impacted line items presented below. For additional details, refer to NOTE 2 - Basis of Presentation and Summary of Significant Accounting Policies
and NOTE 20 Segment Reporting on our Annual Report on Form 10-K and consolidated statements of operations and segment financials sections on our fourth quarter 2022 earnings press release for the three months and year ended
December 31, 2022.
Q3
Q1
0.3 $
0.3 $
0.3 $
0.3 $
310
572
130.2 $
152.2 $
16.6 $
7.1 $
23.8 $
9.7 $
(16.3) $
Q4
0.4
0.4
0.5
0.5
Q2
Represents company-operated shop gross profit plus depreciation, see Company-operated Shop Results on slide 17 for reconciliation to the most directly comparable financial measure stated in accordance with GAAP
17
2022
336
603
160.5 $
186.4 $
31.2 $
8.3 $
39.5 $
23.9 $
(1.8) $
Q3
370
641
173.5 $
198.6 $
34.7 $
9.6 $
44.3 $
27.8 $
1.6 $
Q4
396
671
175.5
201.8
38.8
11.2
50.0
29.8
(2.8)View entire presentation