Eos Energy Investor Presentation Deck
●
●
Path to Profitability
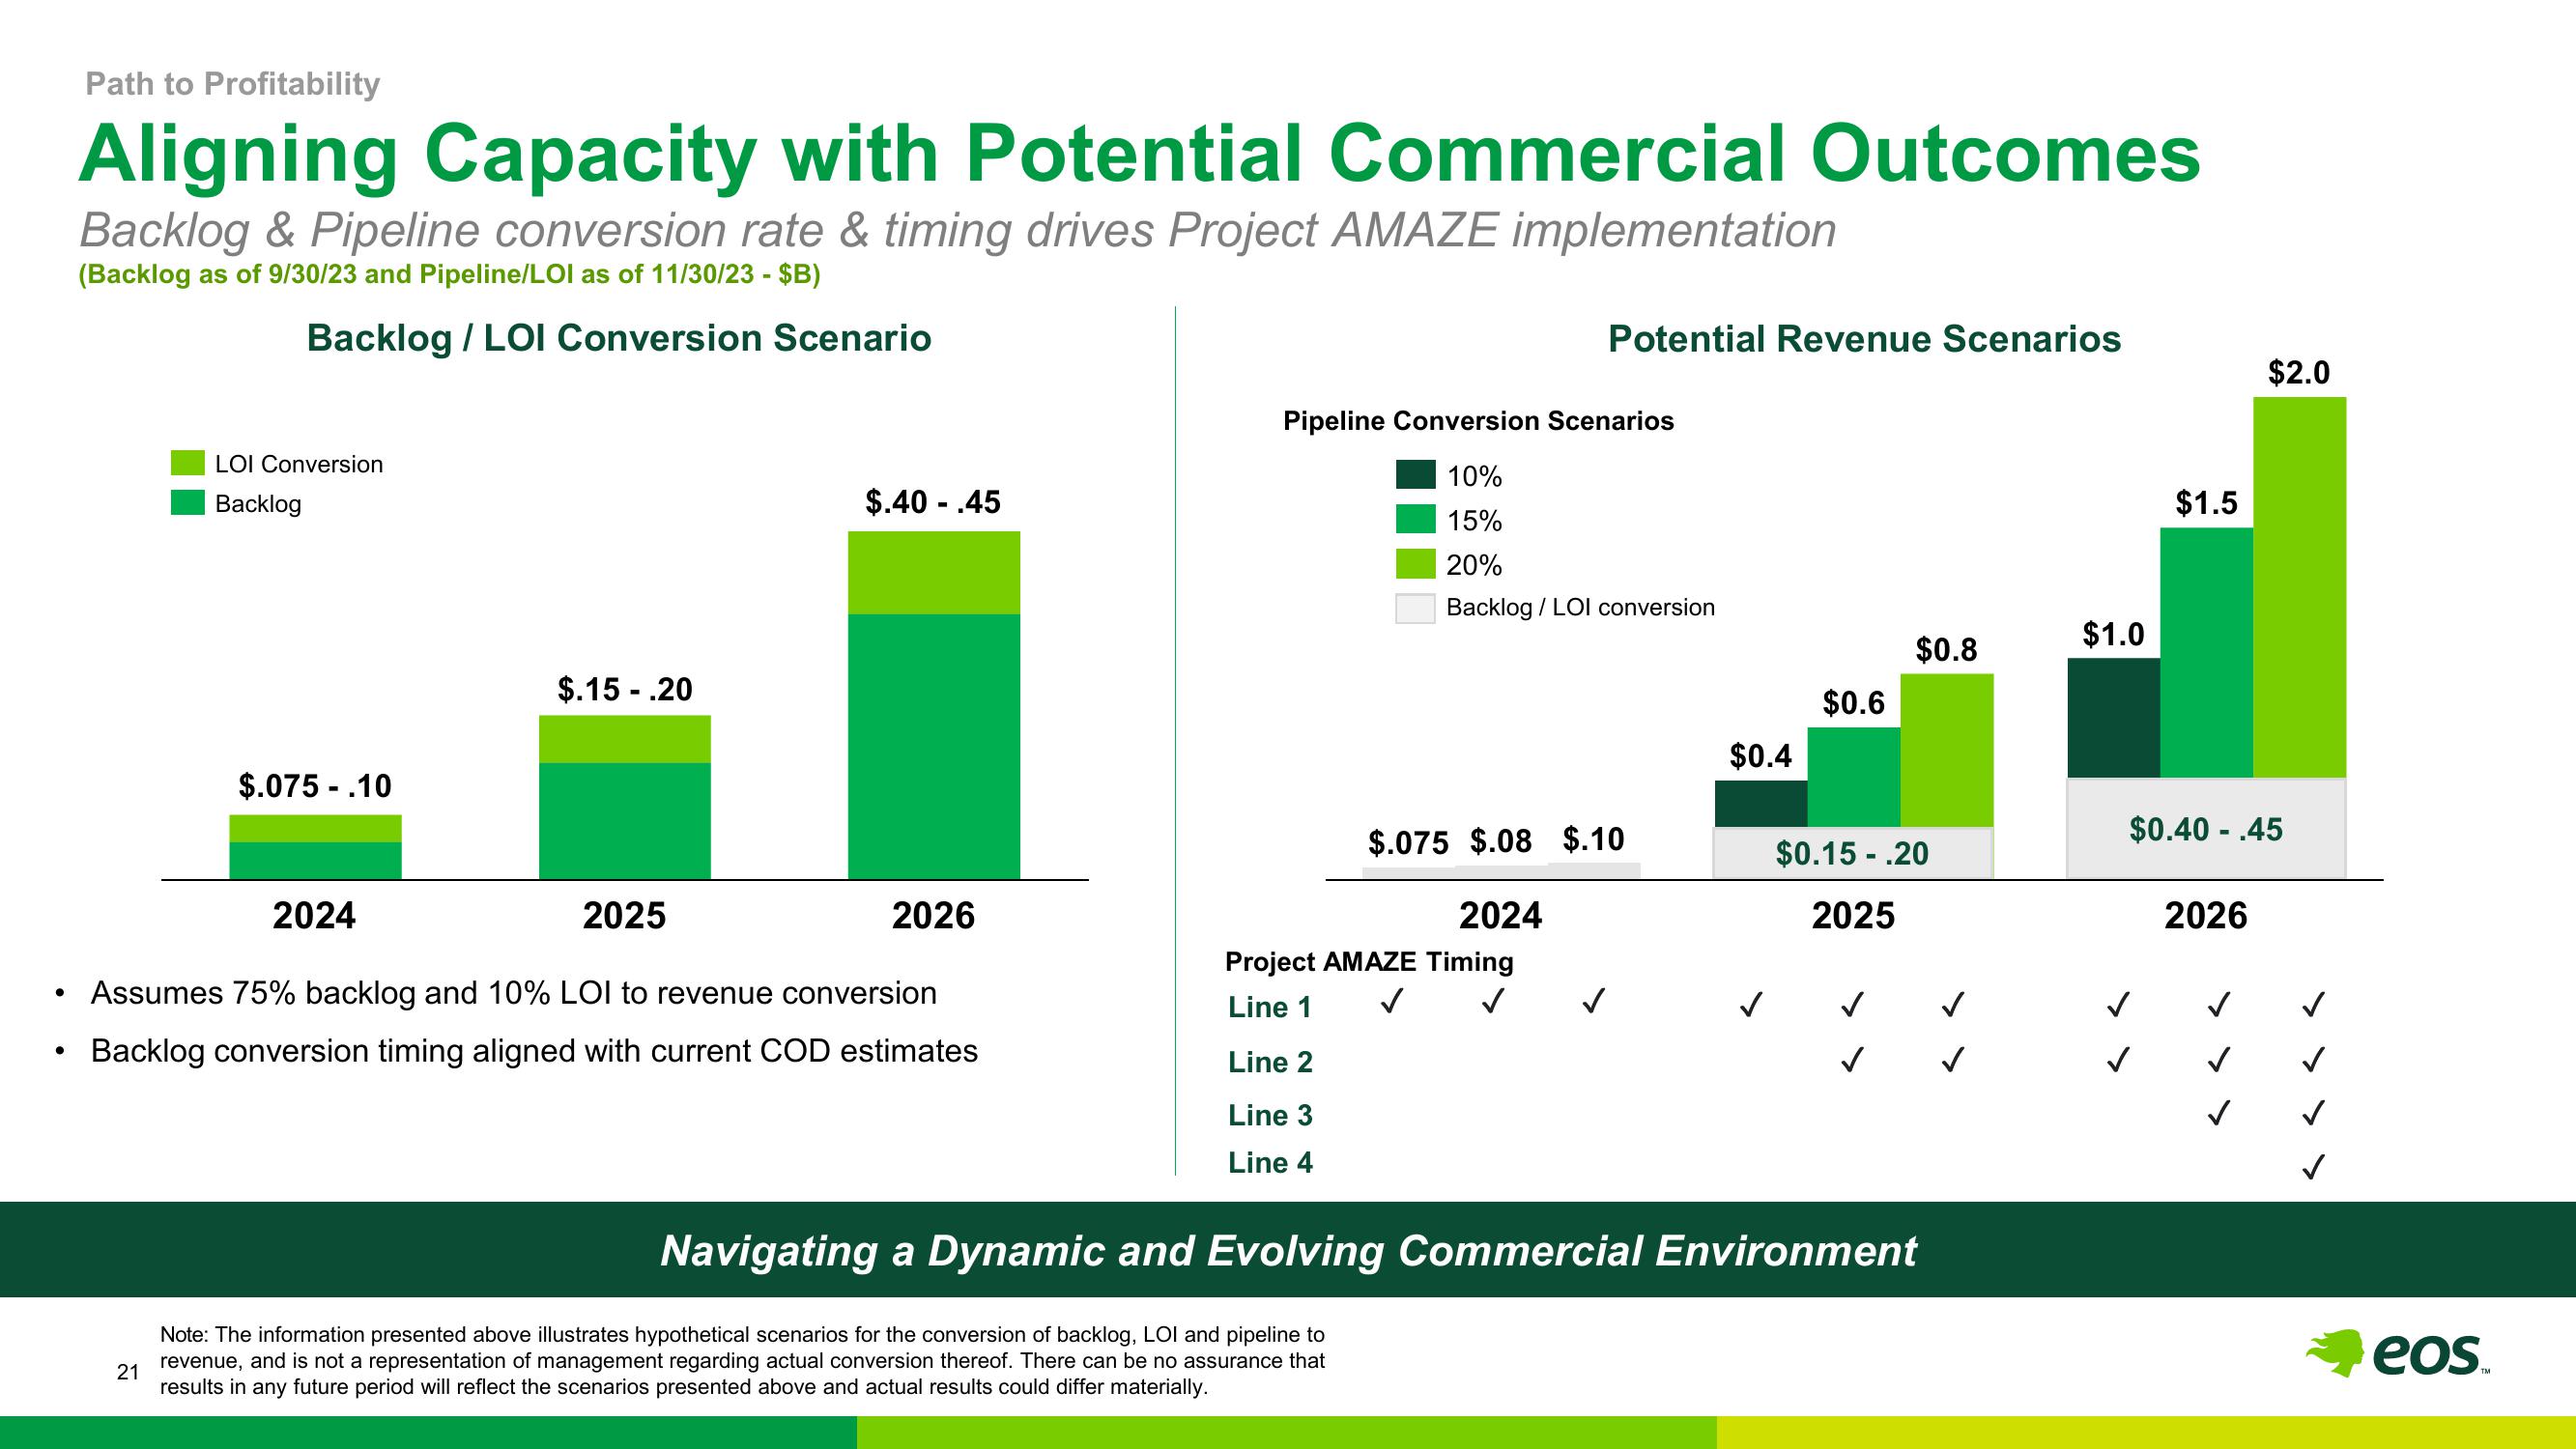
Aligning Capacity with Potential Commercial Outcomes
Backlog & Pipeline conversion rate & timing drives Project AMAZE implementation
(Backlog as of 9/30/23 and Pipeline/LOI as of 11/30/23 - $B)
Backlog / LOI Conversion Scenario
21
LOI Conversion
Backlog
$.075.10
2024
$.15.20
2025
$.40.45
2026
Assumes 75% backlog and 10% LOI to revenue conversion
Backlog conversion timing aligned with current COD estimates
Pipeline Conversion Scenarios
10%
15%
20%
Backlog / LOI conversion
Potential Revenue Scenarios
Project AMAZE Timing
Line 1
Line 2
Line 3
Line 4
$.075 $.08 $.10
2024
Note: The information presented above illustrates hypothetical scenarios for the conversion of backlog, LOI and pipeline to
revenue, and is not a representation of management regarding actual conversion thereof. There can be no assurance that
results in any future period will reflect the scenarios presented above and actual results could differ materially.
$0.4
$0.6
$0.8
$0.15.20
2025
Navigating a Dynamic and Evolving Commercial Environment
$1.0
$1.5
$2.0
$0.40.45
2026
eosView entire presentation