WeWork Investor Presentation Deck
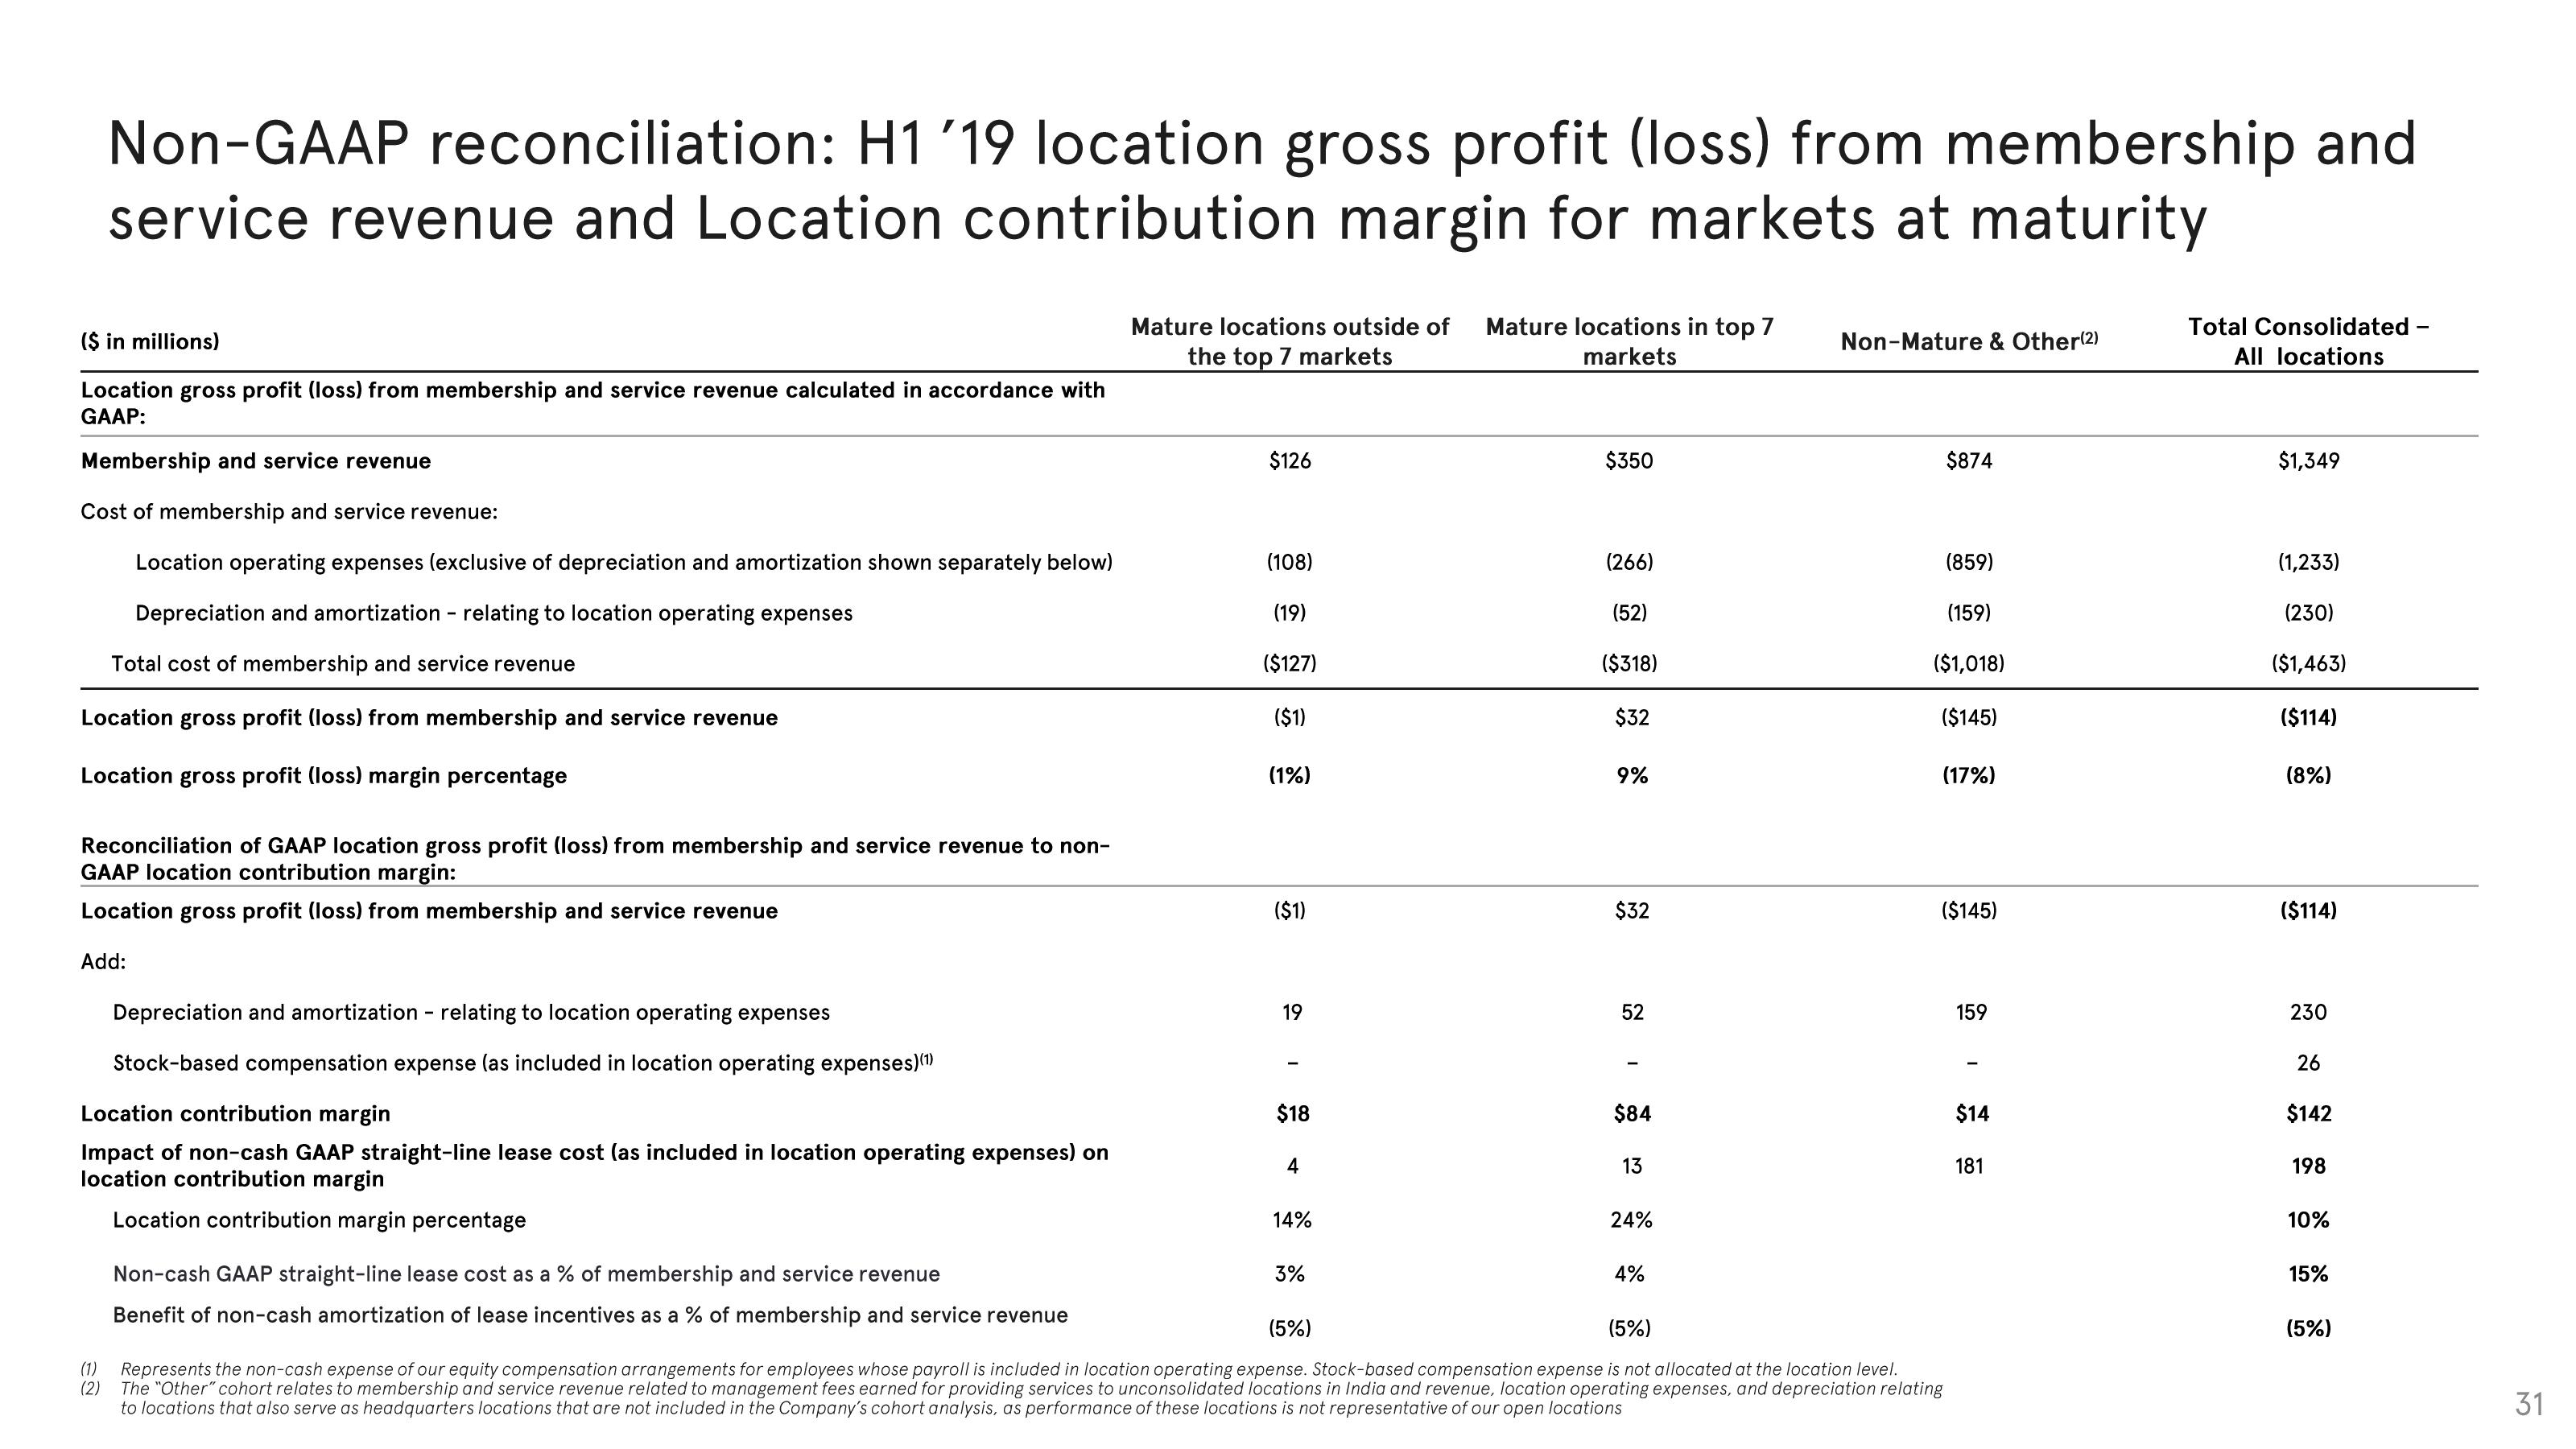
Non-GAAP reconciliation: H1 '19 location gross profit (loss) from membership and
service revenue and Location contribution margin for markets at maturity
($ in millions)
Location gross profit (loss) from membership and service revenue calculated in accordance with
GAAP:
Membership and service revenue
Cost of membership and service revenue:
Location operating expenses (exclusive of depreciation and amortization shown separately below)
Depreciation and amortization - relating to location operating expenses
Total cost of membership and service revenue
Location gross profit (loss) from membership and service revenue
Location gross profit (loss) margin percentage
Reconciliation of GAAP location gross profit (loss) from membership and service revenue to non-
GAAP location contribution margin:
Location gross profit (loss) from membership and service revenue
Add:
Depreciation and amortization - relating to location operating expenses
Stock-based compensation expense (as included in location operating expenses) (1)
Location contribution margin
Impact of non-cash GAAP straight-line lease cost (as included in location operating expenses) on
location contribution margin
Location contribution margin percentage
Mature locations outside of Mature locations in top 7
the top 7 markets
markets
$126
(108)
(19)
($127)
($1)
(1%)
($1)
19
$18
4
14%
$350
3%
(266)
(52)
($318)
$32
9%
$32
52
$84
13
24%
4%
Non-Mature & Other(2)
$874
(859)
(159)
($1,018)
($145)
Non-cash GAAP straight-line lease cost as a % of membership and service revenue
(5%)
(5%)
Benefit of non-cash amortization of lease incentives as a % of membership and service revenue
(1) Represents the non-cash expense of our equity compensation arrangements for employees whose payroll is included in location operating expense. Stock-based compensation expense is not allocated at the location level.
(2) The "Other" cohort relates to membership and service revenue related to management fees earned for providing services to unconsolidated locations in India and revenue, location operating expenses, and depreciation relating
to locations that also serve as headquarters locations that are not included in the Company's cohort analysis, as performance of these locations is not representative of our open locations
(17%)
($145)
159
$14
181
Total Consolidated -
All locations
$1,349
(1,233)
(230)
($1,463)
($114)
(8%)
($114)
230
26
$142
198
10%
15%
(5%)
31View entire presentation