Silicon Valley Bank Results Presentation Deck
Focus Area: Leveraging client liquidity
SVB's deposit franchise is a competitive advantage
Client operating accounts make up the majority of our deposits (noninterest bearing
deposits 71% of period-end total deposits)
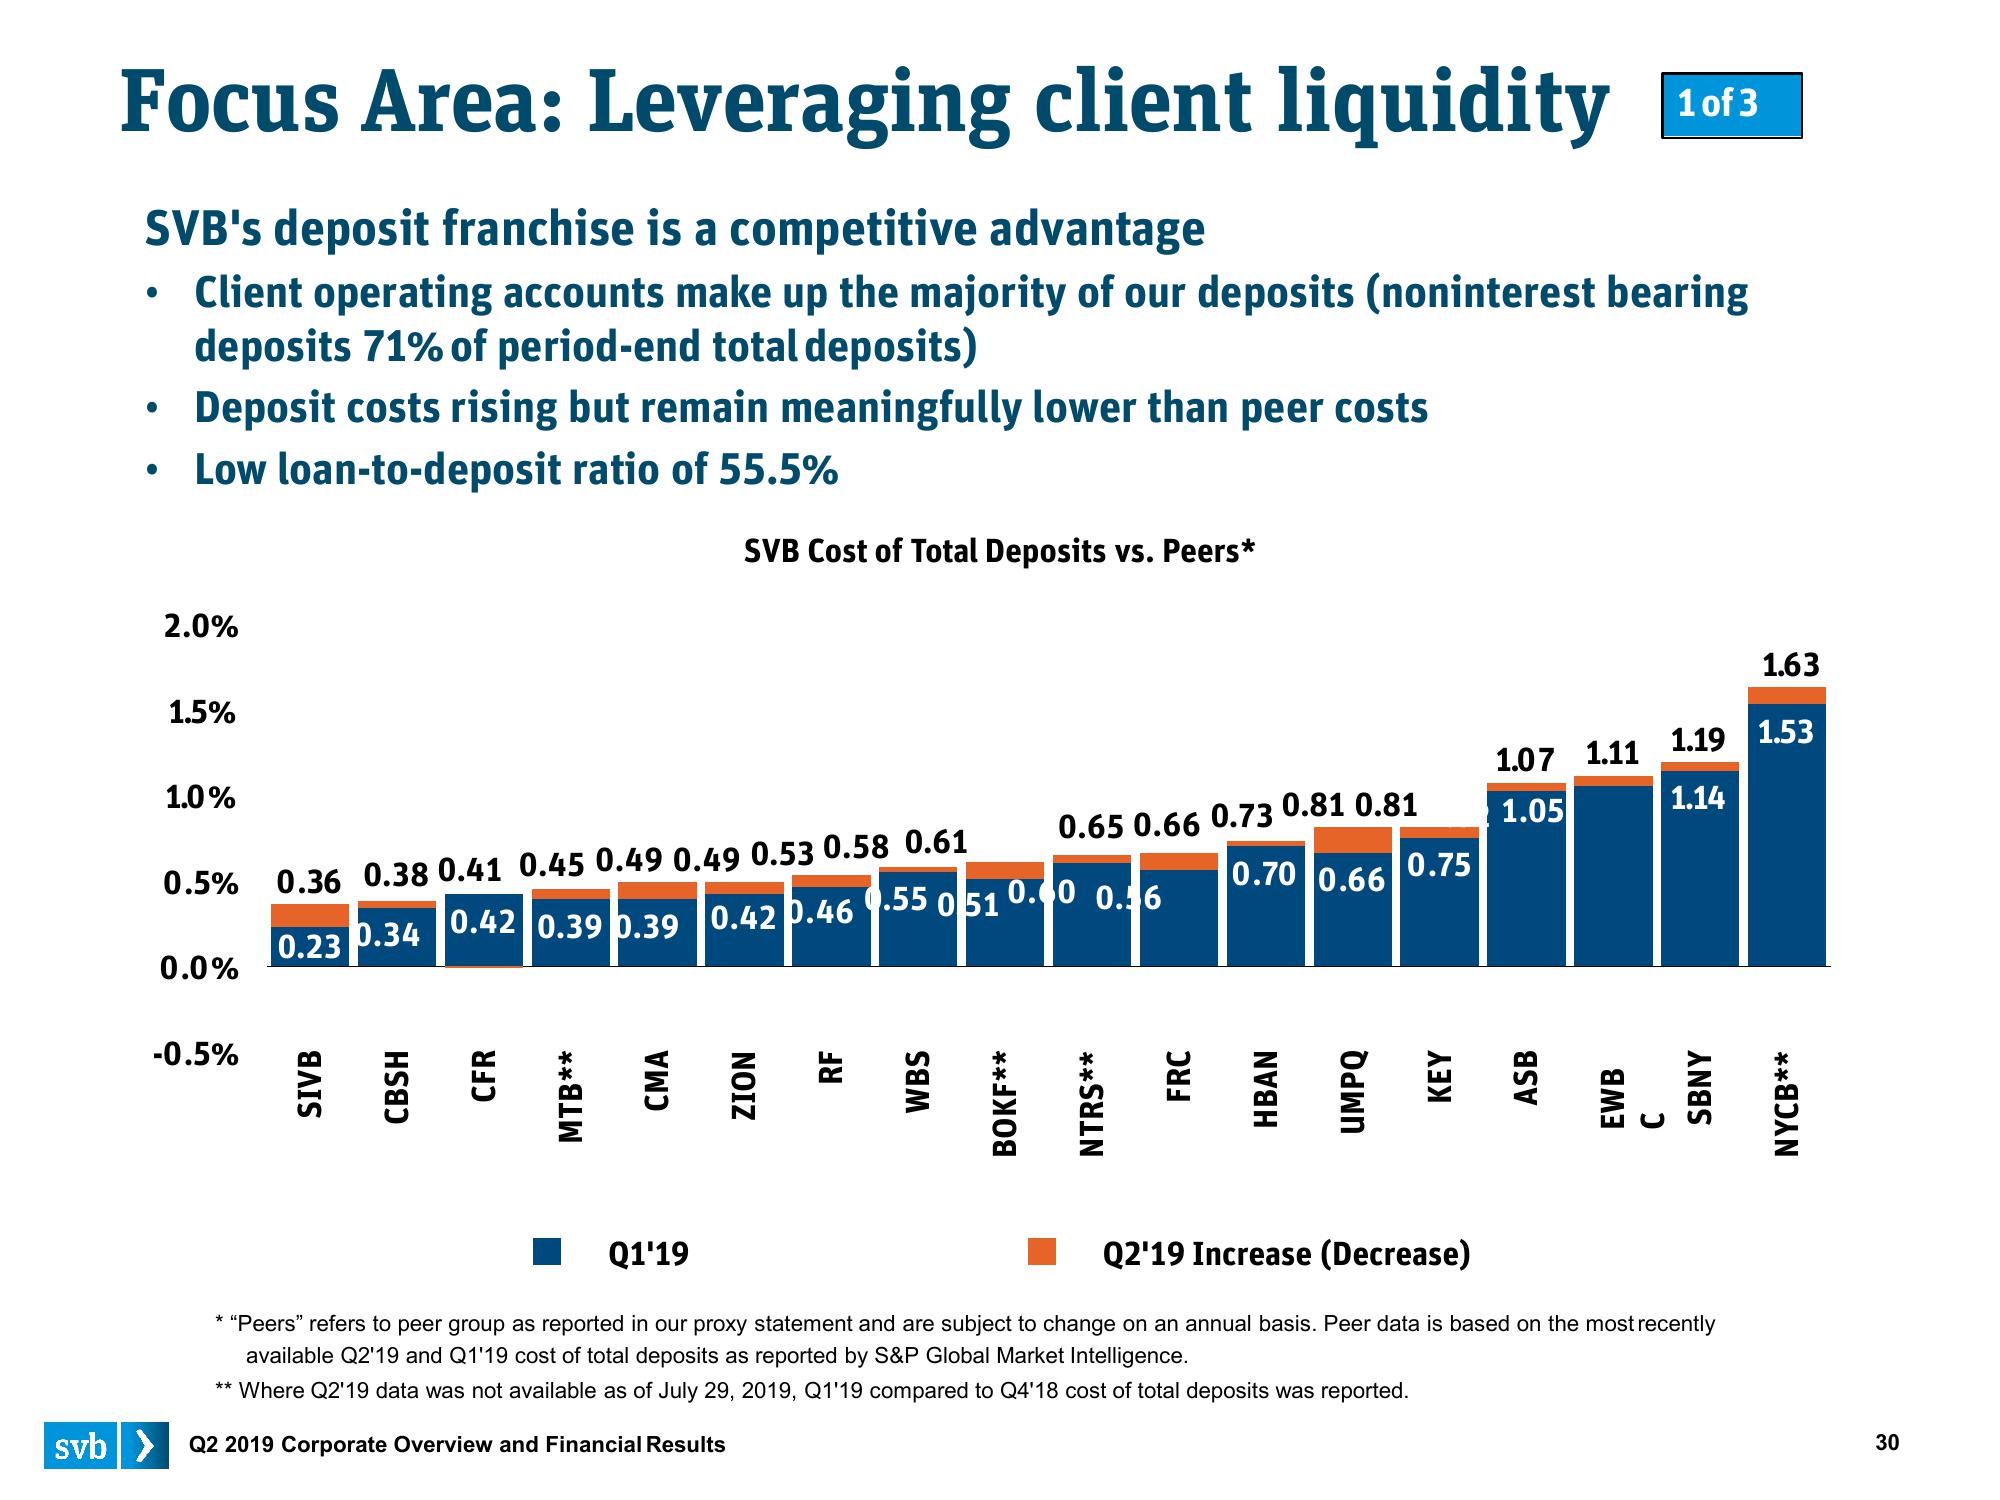
Deposit costs rising but remain meaningfully lower than peer costs
Low loan-to-deposit ratio of 55.5%
●
●
2.0%
1.5%
1.0%
0.5%
0.0%
-0.5%
**
0.36 0.38 0.41 0.45 0.49 0.49 0.53 0.58 0.61
0.55 051
0.42 0.39 0.39
0.42 0.46
0.23
0.34
SIVB
CBSH
CFR
MTB**
CMA
SVB Cost of Total Deposits vs. Peers*
svb> Q2 2019 Corporate Overview and Financial Results
ZION
RF
WBS
0.65 0.66 0.73 0.81 0.81
0.70 0.66
0.60 0.56
BOKF**
NTRS**
FRC
HBAN
UMPQ
0.75
KEY
1.07 1.11
1.05
ASB
1 of 3
1.63
1.19 1.53
1.14
Q1'19
Q2'19 Increase (Decrease)
* "Peers" refers to peer group as reported in our proxy statement and are subject to change on an annual basis. Peer data is based on the most recently
available Q2'19 and Q1'19 cost of total deposits as reported by S&P Global Market Intelligence.
Where Q2'19 data was not available as of July 29, 2019, Q1'19 compared to Q4'18 cost of total deposits was reported.
EWB
SBNY
C
NYCB**
30View entire presentation