Confluent Investor Presentation Deck
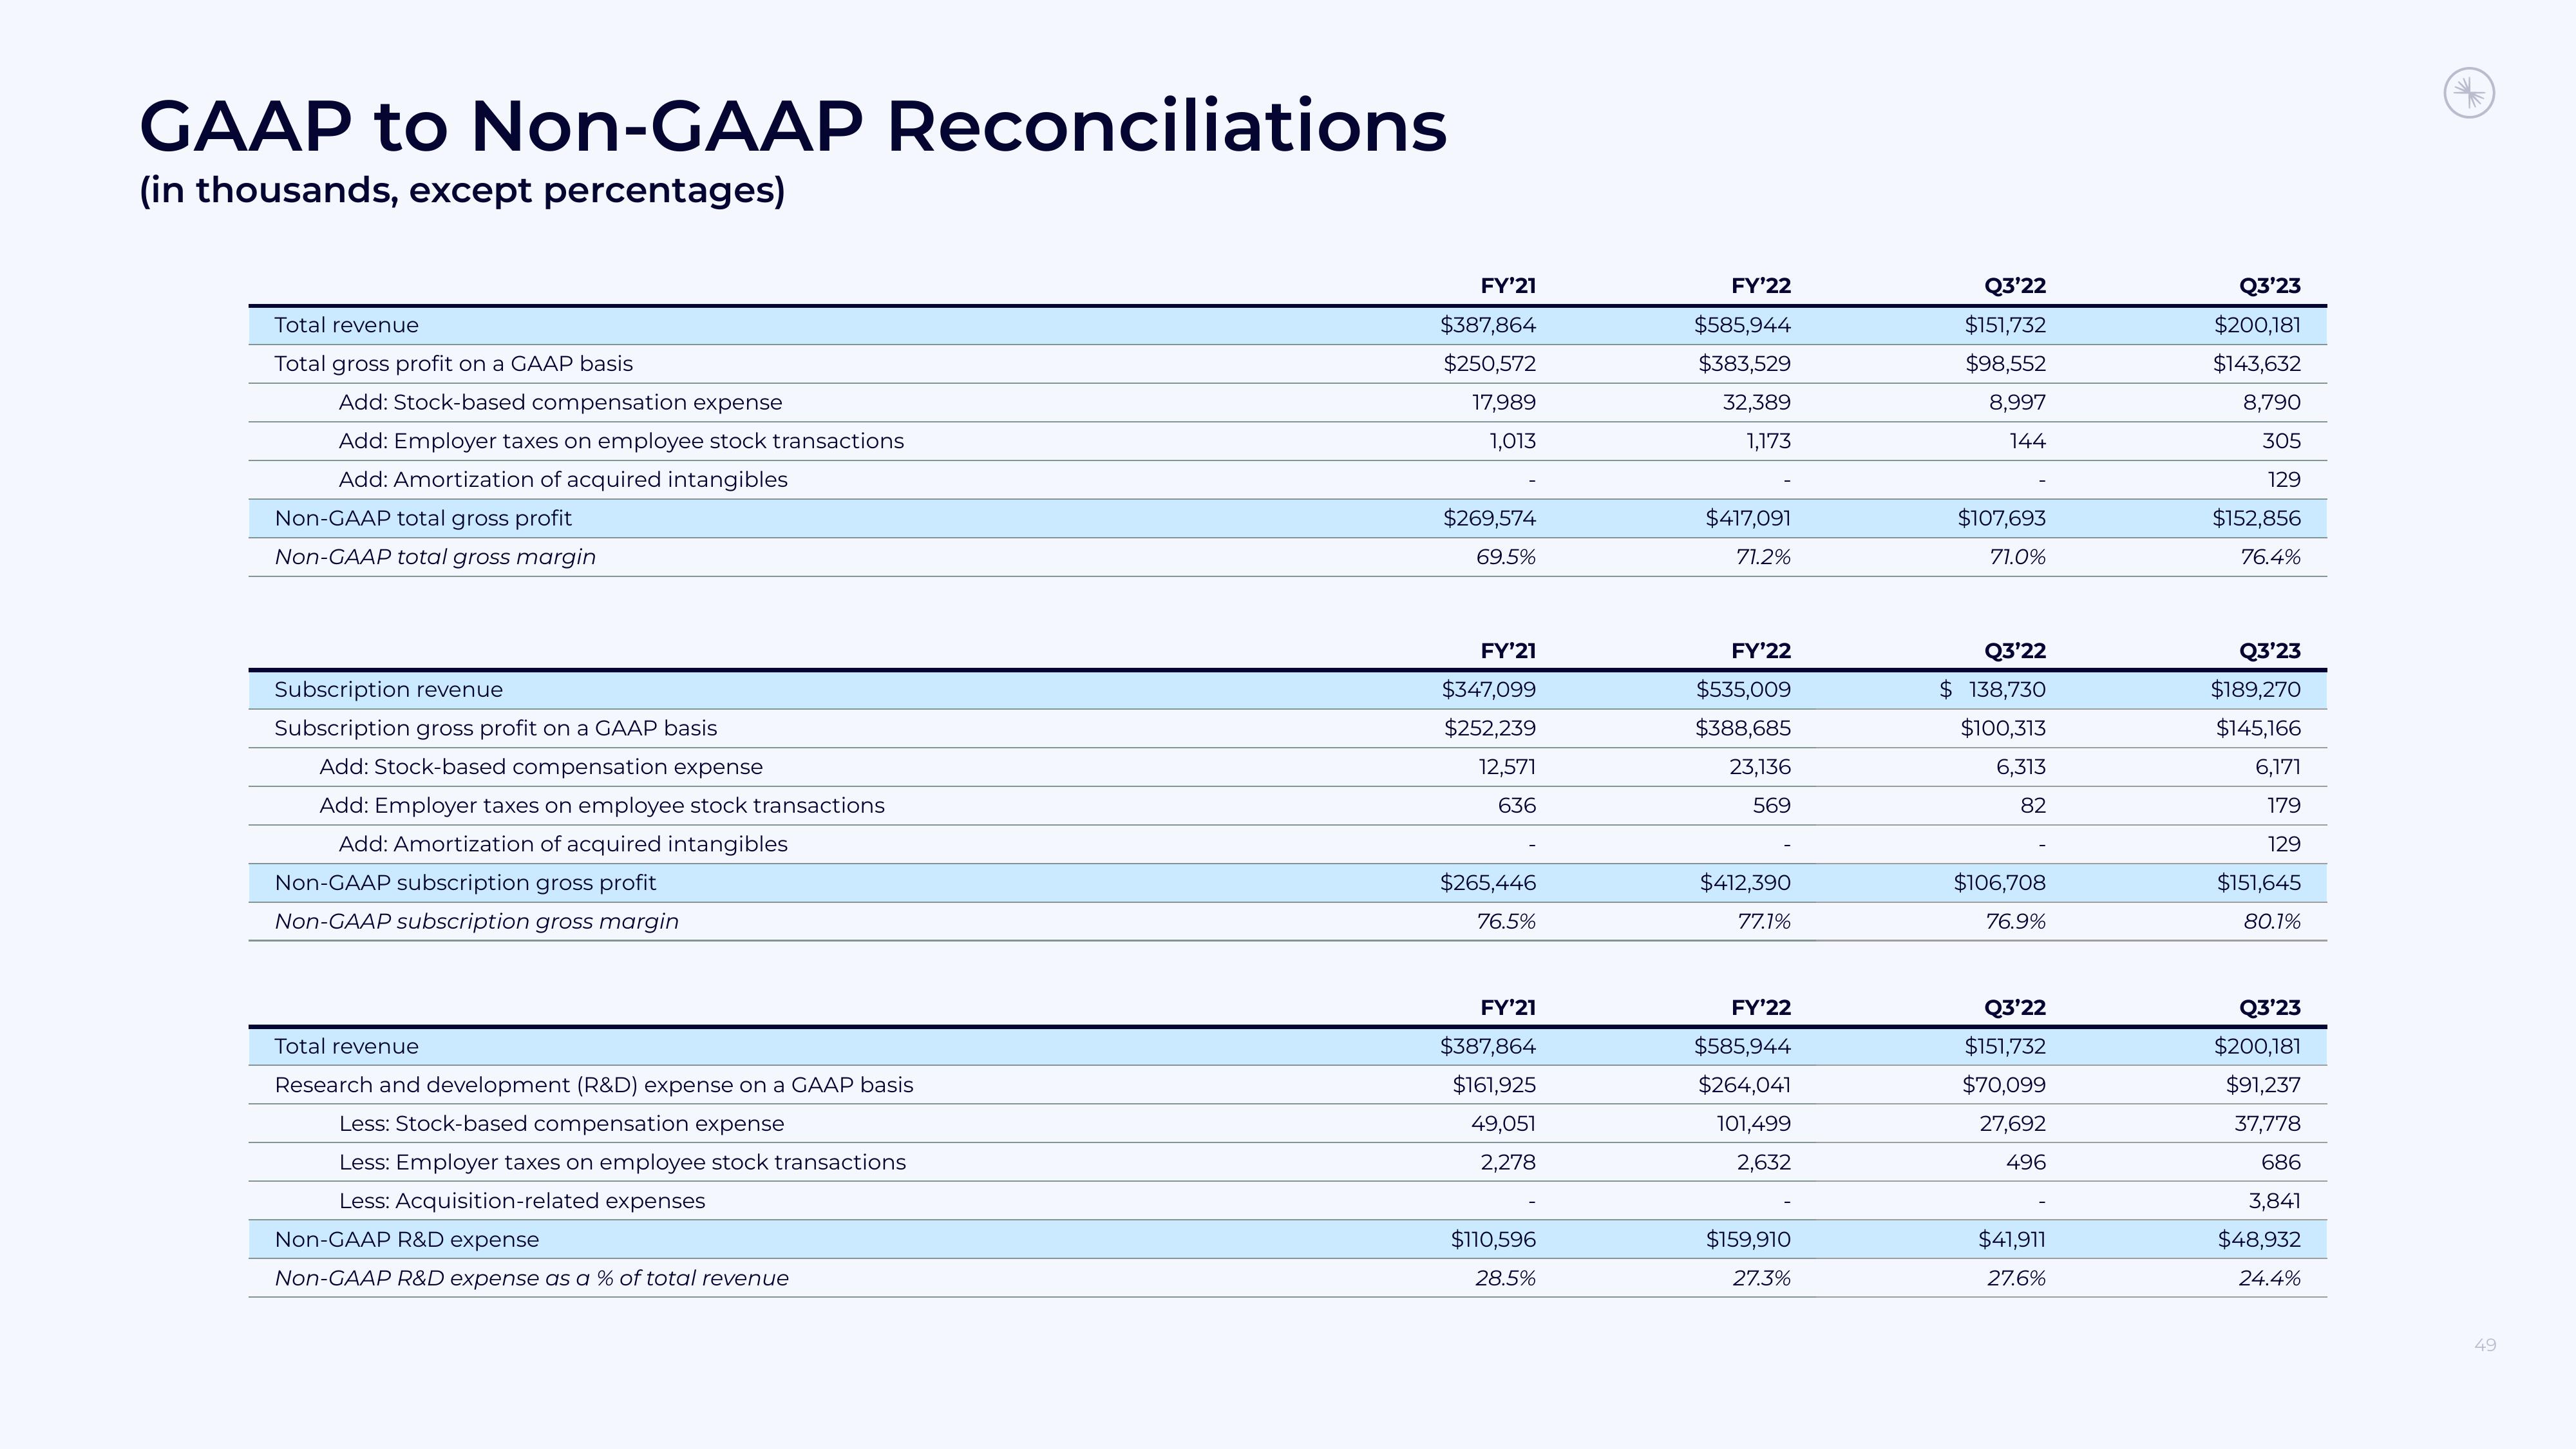
GAAP to Non-GAAP Reconciliations
(in thousands, except percentages)
Total revenue
Total gross profit on a GAAP basis
Add: Stock-based compensation expense
Add: Employer taxes on employee stock transactions
Add: Amortization of acquired intangibles
Non-GAAP total gross profit
Non-GAAP total gross margin
Subscription revenue
Subscription gross profit on a GAAP basis
Add: Stock-based compensation expense
Add: Employer taxes on employee stock transactions
Add: Amortization of acquired intangibles
Non-GAAP subscription gross profit
Non-GAAP subscription gross margin
Total revenue
Research and development (R&D) expense on a GAAP basis
Less: Stock-based compensation expense
Less: Employer taxes on employee stock transactions
Less: Acquisition-related expenses
Non-GAAP R&D expense
Non-GAAP R&D expense as a % of total revenue
FY'21
$387,864
$250,572
17,989
1,013
$269,574
69.5%
FY'21
$347,099
$252,239
12,571
636
$265,446
76.5%
FY'21
$387,864
$161,925
49,051
2,278
$110,596
28.5%
FY'22
$585,944
$383,529
32,389
1,173
$417,091
71.2%
FY'22
$535,009
$388,685
23,136
569
$412,390
77.1%
FY'22
$585,944
$264,041
101,499
2,632
$159,910
27.3%
Q3'22
$151,732
$98,552
8,997
144
$107,693
71.0%
Q3'22
$ 138,730
$100,313
6,313
82
$106,708
76.9%
Q3'22
$151,732
$70,099
27,692
496
$41,911
27.6%
Q3'23
$200,181
$143,632
8,790
305
129
$152,856
76.4%
Q3'23
$189,270
$145,166
6,171
179
129
$151,645
80.1%
Q3'23
$200,181
$91,237
37,778
686
3,841
$48,932
24.4%
49View entire presentation