Evercore Investment Banking Pitch Book
Appendix
Financial Summary
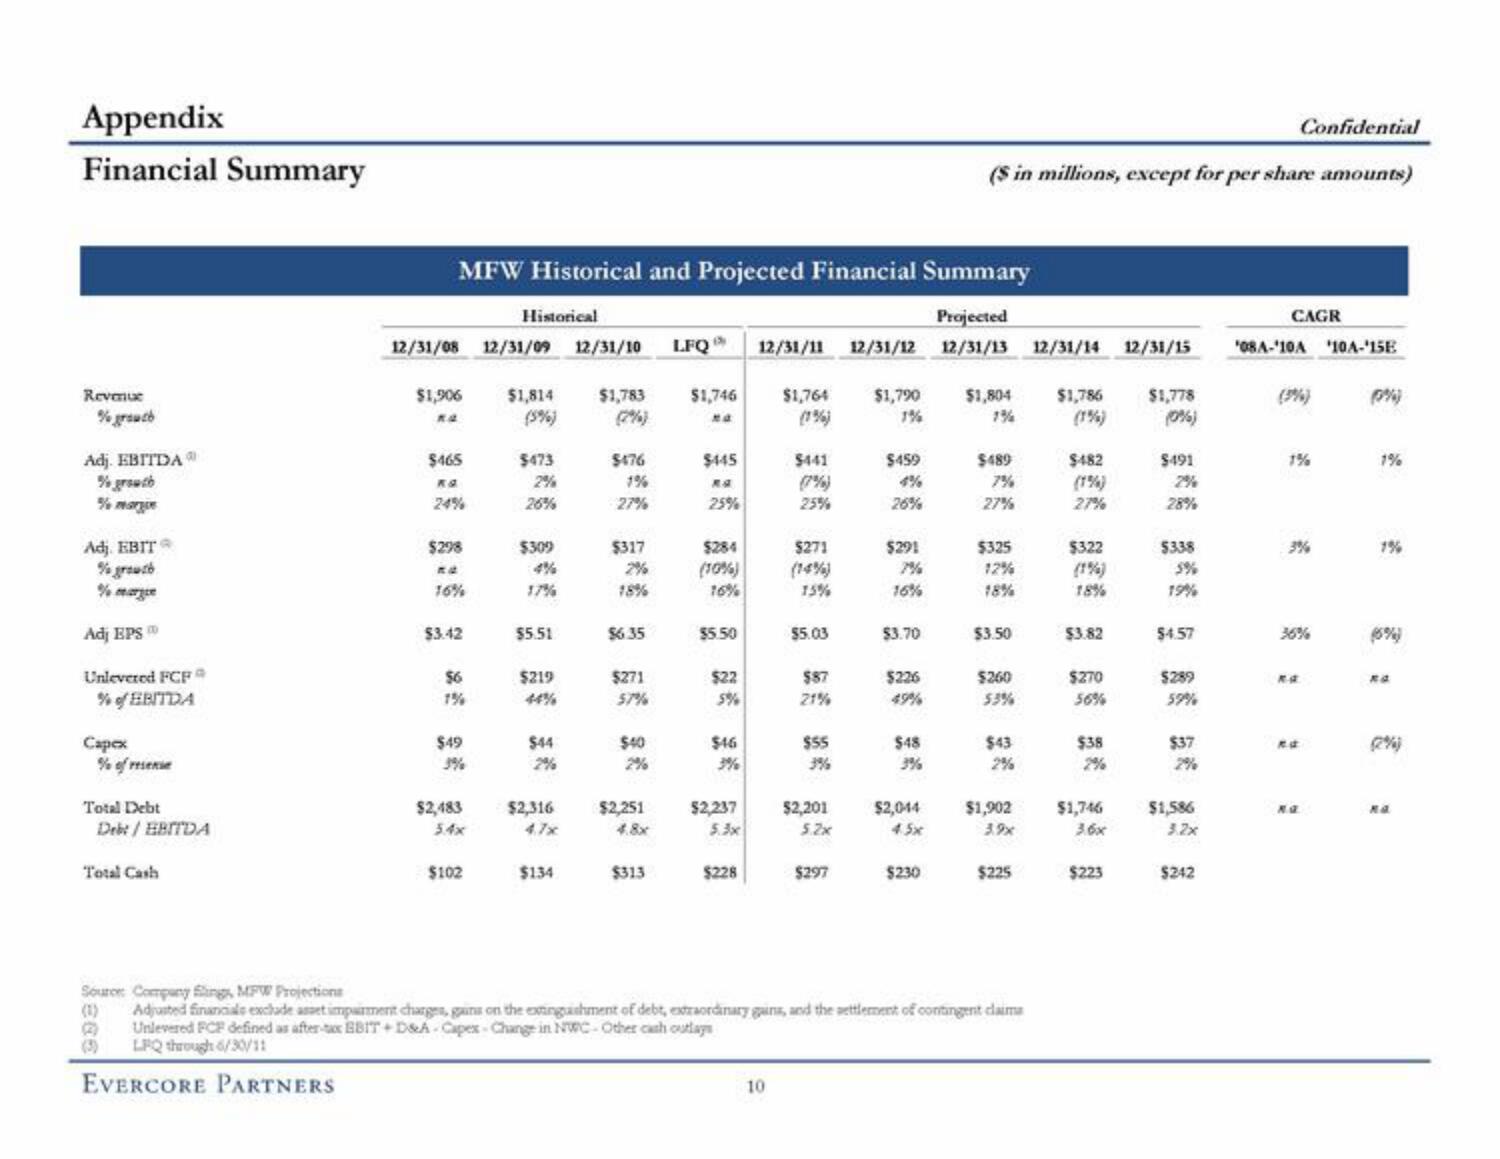
Revenue
% grauch
Adj. EBITDA
% growch
% margue
Adj. EBITⓇ
% growth
% marge
Adj EPS
Unlevered FCF
% of EBITDA
Capex
% of resense
Total Debt
Debt/EBITDA
Total Cash
MFW Historical and Projected Financial Summary
Projected
LFQ 12/31/11 12/31/12 12/31/13 12/31/14 12/31/15
12/31/08 12/31/09 12/31/10
$1,906
Ka
$465
24%
$298
na
76%
$3.42
$6
1%
$49
3%
$2,483
5.4x
Historical
$102
$1,814 $1,783
(5%)
(2%)
$473
2%
26%
$309
17%
$5.51
$219
$44
$2,316
$134
$476
1%
27%
$317
2%
$6.35
$271
57%
$40
$2,251
4.8x
$313
$1,746
na
$445
R.A.
25%
$284
(10%)
16%
$5.50
$22
5%
$46
3%
$2,237
5.3x
$228
$1,764
(1%)
10
$441
(7%)
25%
$271
(14%)
75%
$5.03
$87
21%
$55
3%
$2,201
5.2x
$297
$1,790
1%
$459
26%
$291
16%
$3.70
$226
49%
$48
$2,044
4.5x
$230
($ in millions, except for per share amounts)
$1,804
$489
7%
27%
$325
12%
18%
$3.50
$260
53%
$43
2%
$1,902
$225
Source Company Slings, MPW Projections
Adjusted financials exclude asset impairment charges, gains on the extinguishment of debt, extraordinary gains, and the settlement of contingent claims
Unlevered FCF defined as after-tax BBIT+D&A Capex-Change in NWC-Other cash outlays
LPQ through 6/30/11
EVERCORE PARTNERS
$1,786
(1%)
$482
27%
$322
(1%)
18%
$3.82
$270
56%
$38
$1,746
3.6x
$223
$1,778
(0%)
$491
2%
28%
$338
5%
19%
$4.57
$289
59%
$37
2%
$1,586
3.2x
$242
Confidential
CAGR
'08A-'10A '10-'15E
(9%)
1%
36%
nd
Ra
(0%)
1%
(6%)
Ra
naView entire presentation