Ginkgo Results Presentation Deck
Cell Program Counts
New Programs
Current Active Programs
Cumulative Programs
Three Months Ended December 31,
2021
10
60
105
2020
3
44
74
Year Ended December 31,
2021
31
71
105
2020
18
49
74
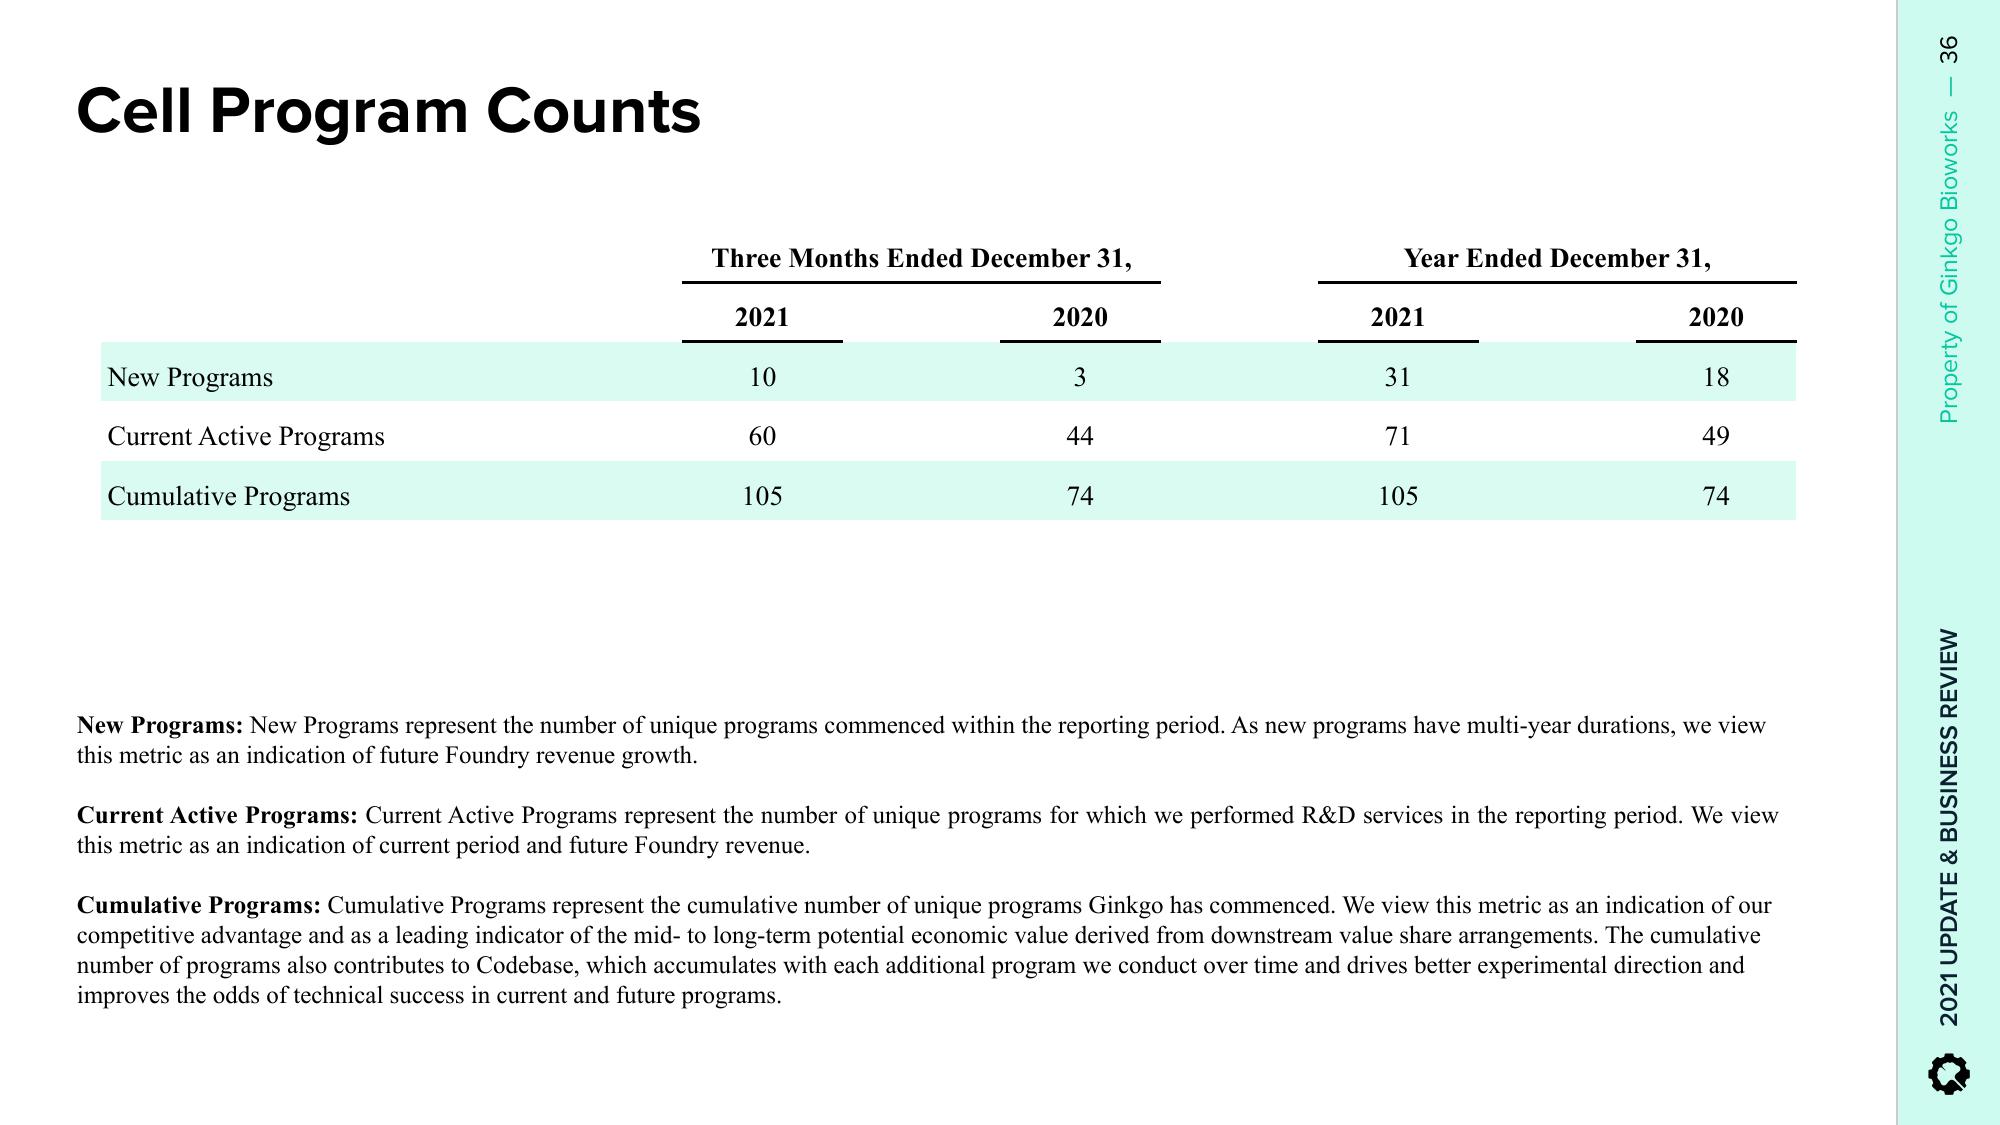
New Programs: New Programs represent the number of unique programs commenced within the reporting period. As new programs have multi-year durations, we view
this metric as an indication of future Foundry revenue growth.
Current Active Programs: Current Active Programs represent the number of unique programs for which we performed R&D services in the reporting period. We view
this metric as an indication of current period and future Foundry revenue.
Cumulative Programs: Cumulative Programs represent the cumulative number of unique programs Ginkgo has commenced. We view this metric as an indication of our
competitive advantage and as a leading indicator of the mid- to long-term potential economic value derived from downstream value share arrangements. The cumulative
number of programs also contributes to Codebase, which accumulates with each additional program we conduct over time and drives better experimental direction and
improves the odds of technical success in current and future programs.
36
Property of Ginkgo Bioworks
2021 UPDATE & BUSINESS REVIEWView entire presentation