Origo Results Presentation Deck
Strong Cash Flow
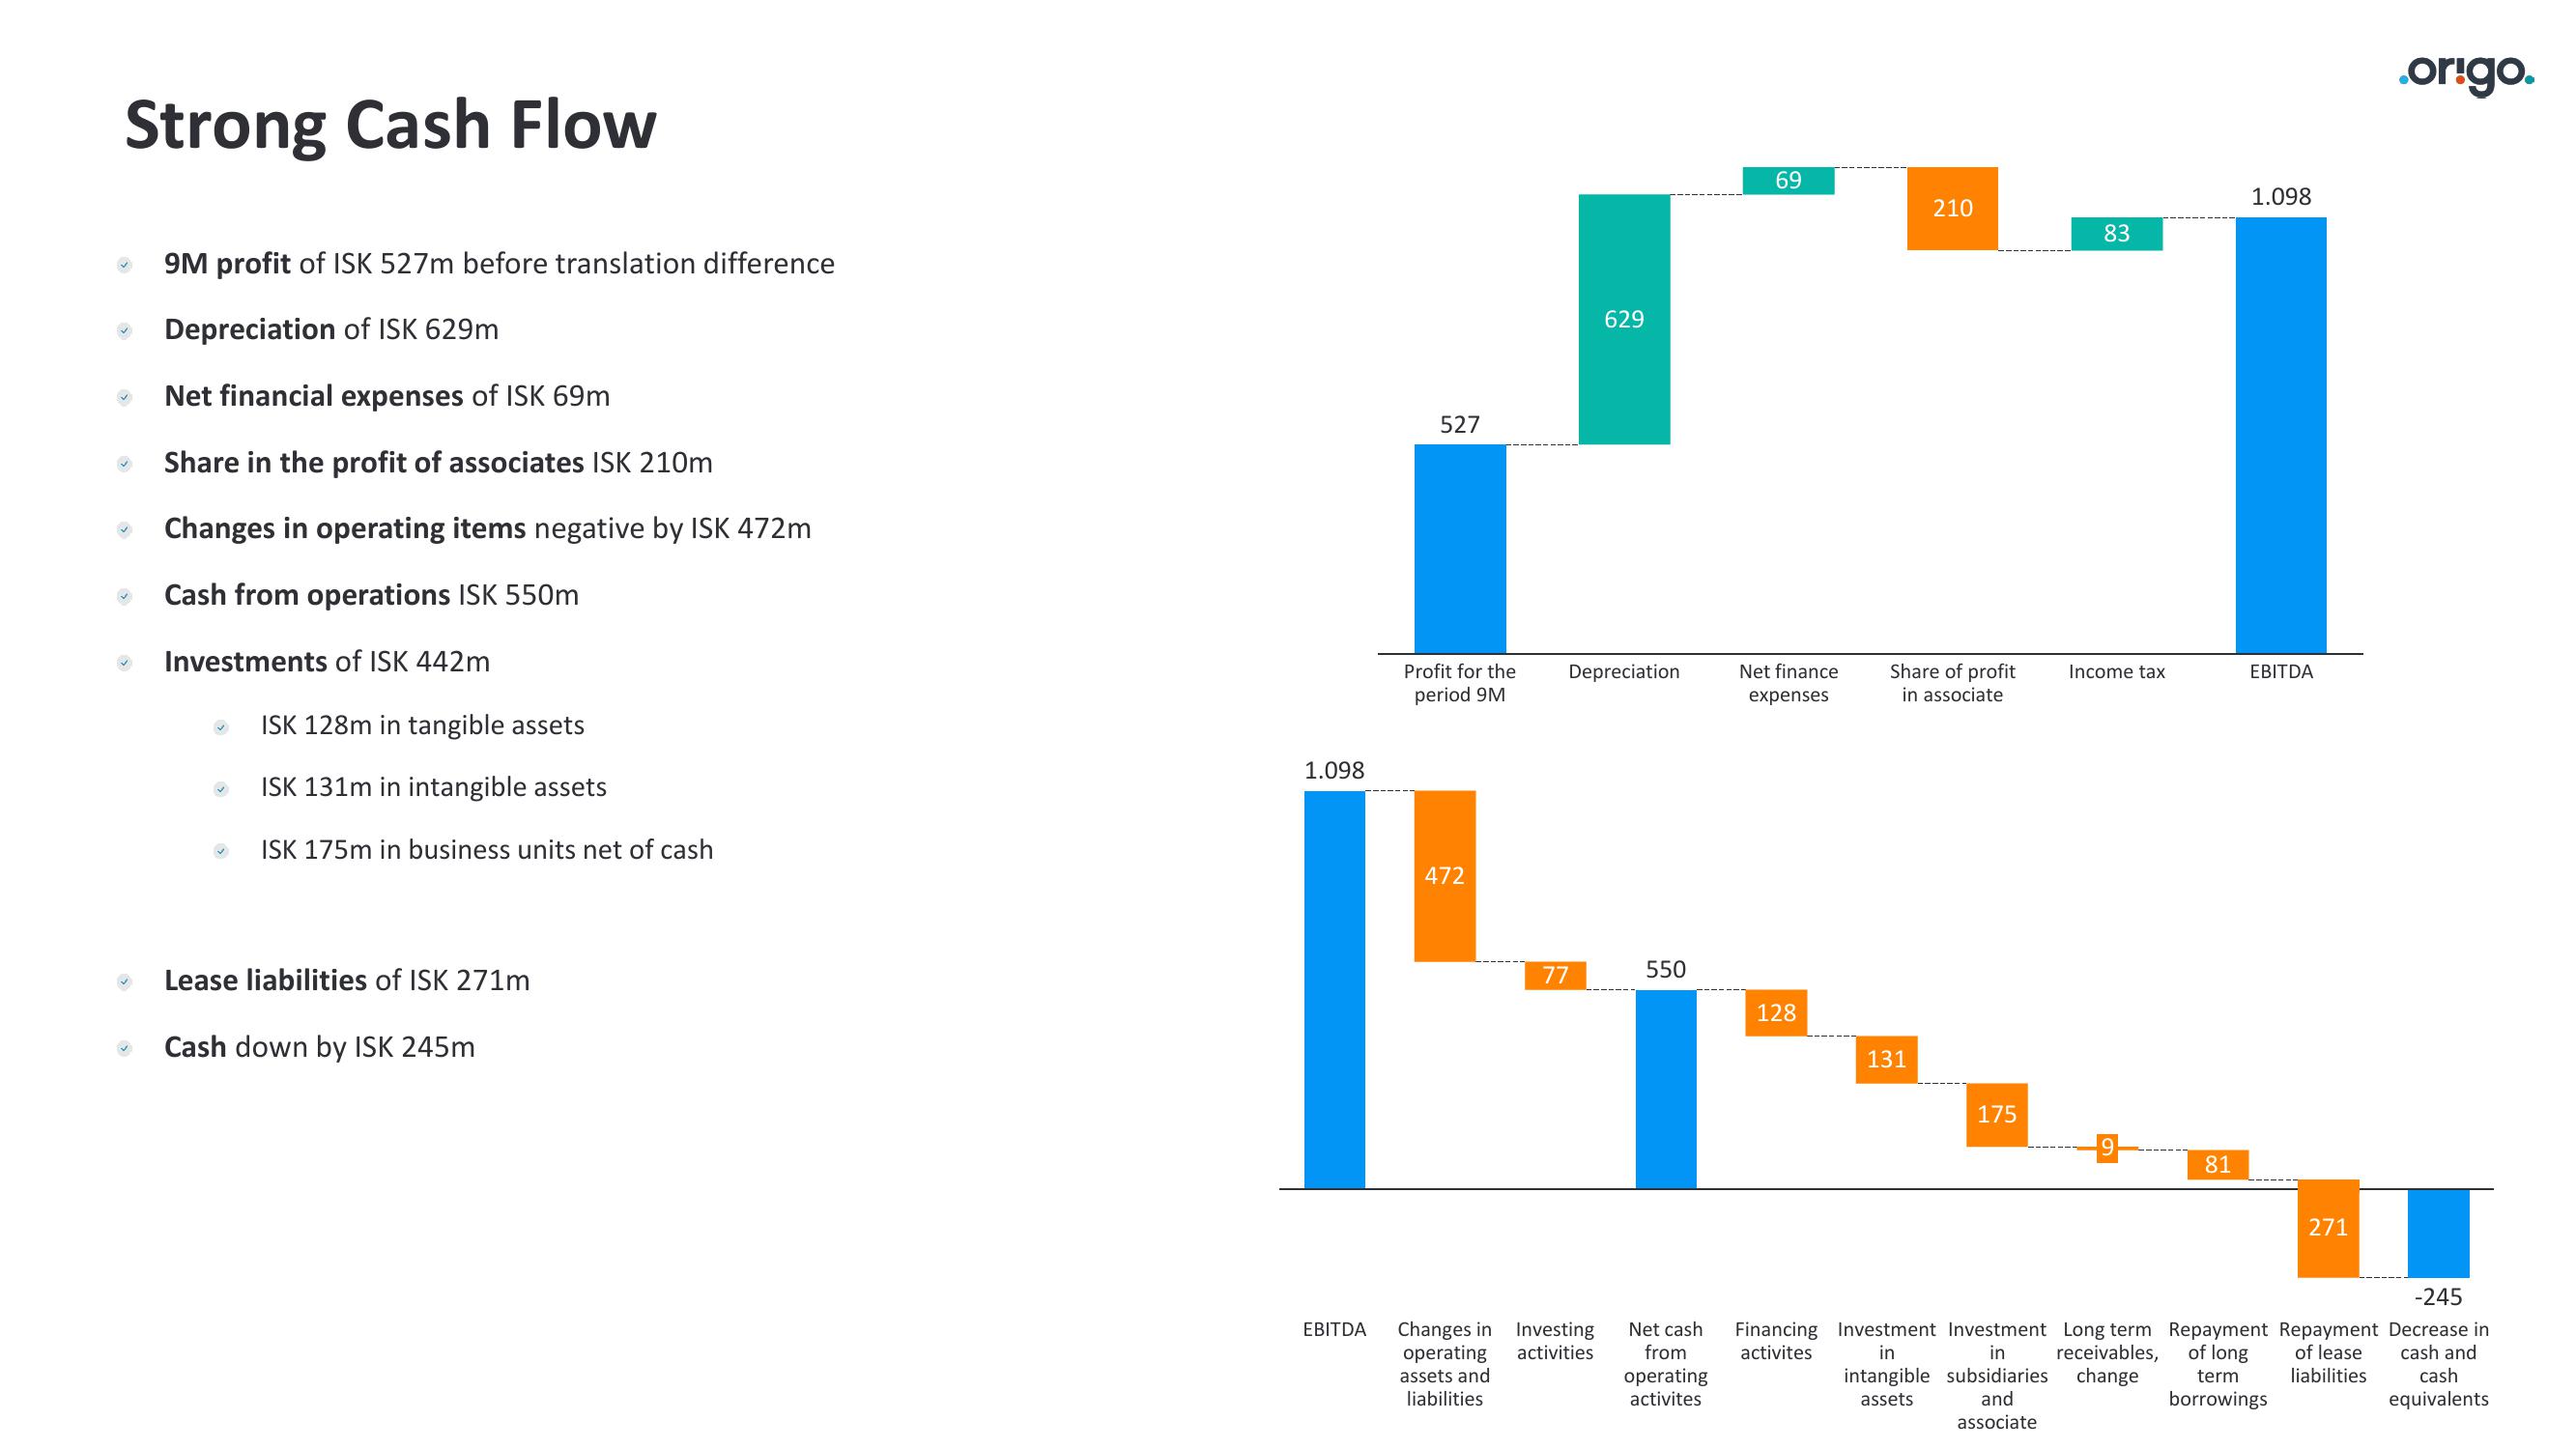
9M profit of ISK 527m before translation difference
Depreciation of ISK 629m
Net financial expenses of ISK 69m
Share in the profit of associates ISK 210m
Changes in operating items negative by ISK 472m
Cash from operations ISK 550m
Investments of ISK 442m
✓
ISK 128m in tangible assets
ISK 131m in intangible assets
ISK 175m in business units net of cash
Lease liabilities of ISK 271m
Cash down by ISK 245m
69
210
83
629
21
Net finance
Share of profit
expenses
in associate
1.098
527
EBITDA
Profit for the
period 9M
472
M
77
550
128
Depreciation
Changes in Investing
operating activities
assets and
liabilities
131
175
Income tax
9
81
1.098
EBITDA
271
.origo.
-245
Net cash Financing Investment Investment Long term Repayment Repayment Decrease in
from
of lease
liabilities
activites
in
in
operating
activites
receivables,
intangible subsidiaries change
and
associate
of long
term
borrowings
cash and
cash
equivalents
assetsView entire presentation