Apollo Global Management Investor Presentation Deck
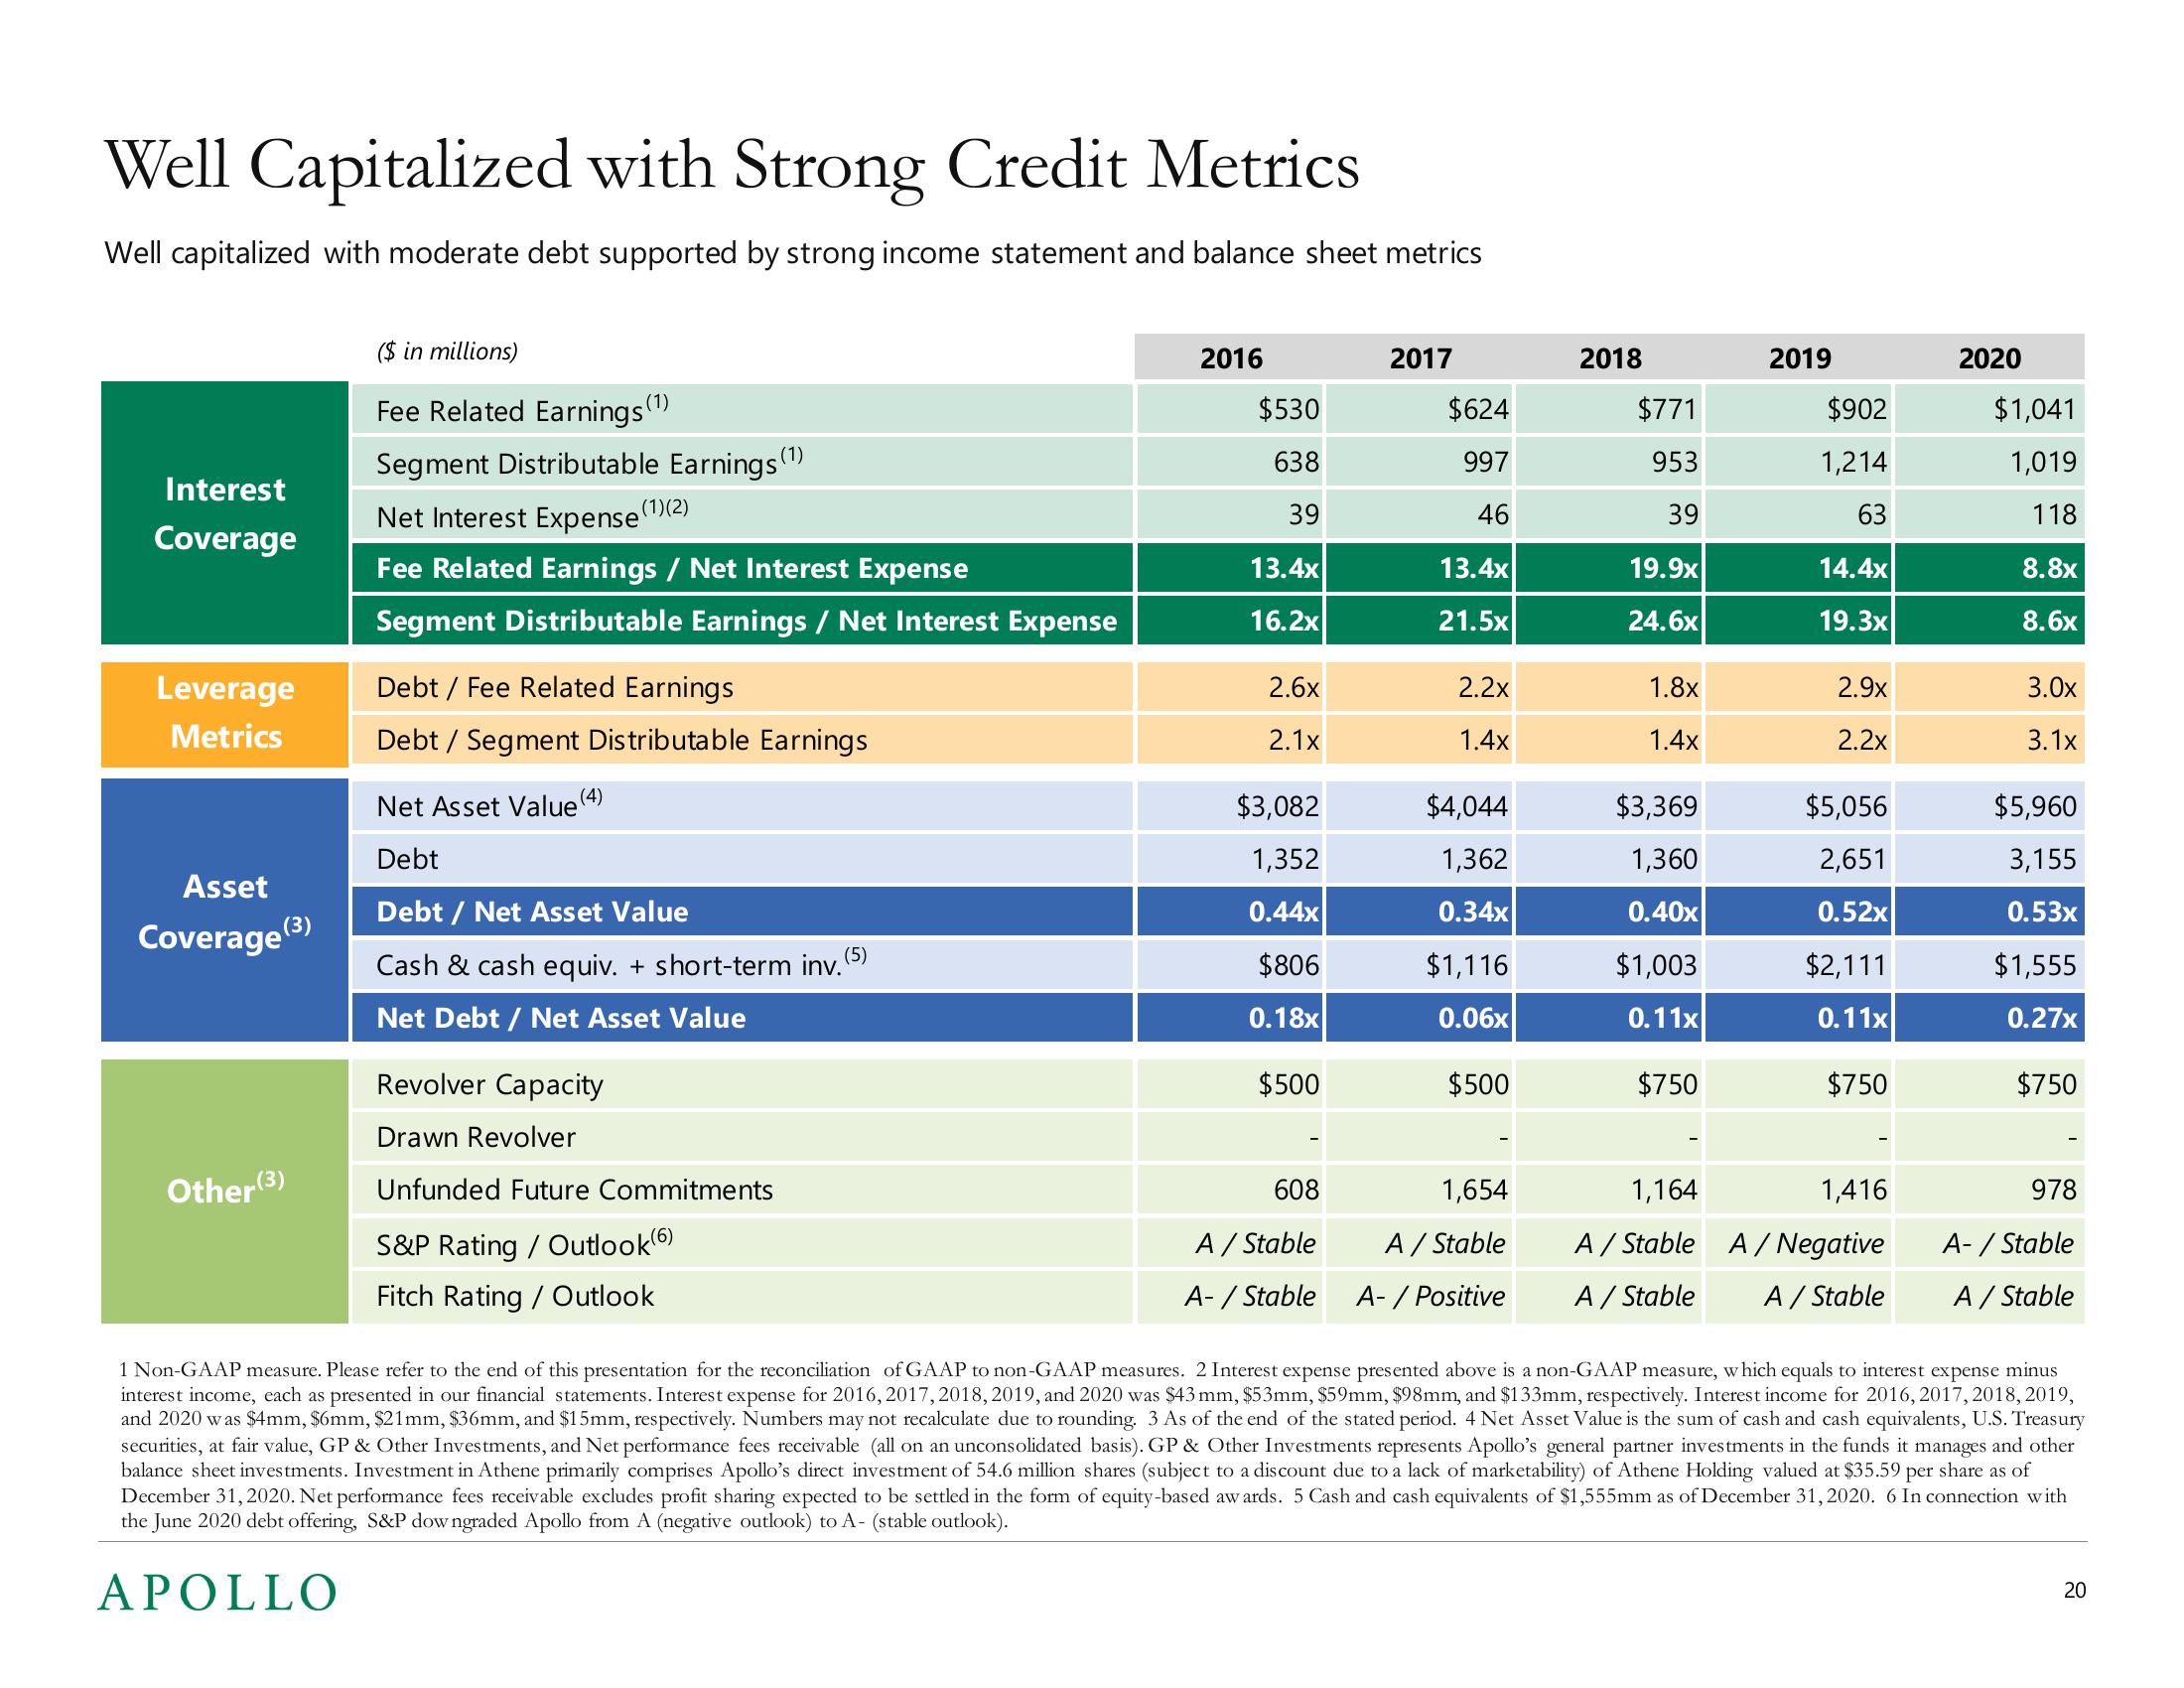
Well Capitalized with Strong Credit Metrics
Well capitalized with moderate debt supported by strong income statement and balance sheet metrics
Interest
Coverage
Leverage
Metrics
Asset
Coverage (3)
Other (3)
($ in millions)
Fee Related Earnings (¹)
Segment Distributable Earnings (¹)
Net Interest Expense
Fee Related Earnings / Net Interest Expense
Segment Distributable Earnings / Net Interest Expense
Debt / Fee Related Earnings
Debt / Segment Distributable Earnings
(4)
(1)(2)
Net Asset Value
Debt
Debt / Net Asset Value
Cash & cash equiv. + short-term inv. (5)
Net Debt / Net Asset Value
Revolver Capacity
Drawn Revolver
Unfunded Future Commitments
S&P Rating / Outlook (6)
Fitch Rating / Outlook
2016
$530
638
39
13.4x
16.2x
2.6x
2.1x
$3,082
1,352
0.44x
$806
0.18x
$500
608
A / Stable
A-/Stable
2017
$624
997
46
13.4x
21.5x
2.2x
1.4x
$4,044
1,362
0.34x
$1,116
0.06x
$500
1,654
A / Stable
A- / Positive
2018
$771
953
39
19.9x
24.6x
1.8x
1.4x
$3,369
1,360
0.40x
$1,003
0.11x
$750
2019
$902
1,214
63
14.4x
19.3x
2.9x
2.2x
$5,056
2,651
0.52x
$2,111
0.11x
$750
1,164
1,416
A/Stable A / Negative
A / Stable
A / Stable
2020
$1,041
1,019
118
8.8x
8.6x
3.0x
3.1x
$5,960
3,155
0.53x
$1,555
0.27x
$750
978
A-/Stable
A / Stable
1 Non-GAAP measure. Please refer to the end of this presentation for the reconciliation of GAAP to non-GAAP measures. 2 Interest expense presented above is a non-GAAP measure, which equals to interest expense minus
interest income, each as presented in our financial statements. Interest expense for 2016, 2017, 2018, 2019, and 2020 was $43 mm, $53mm, $59mm, $98mm, and $133mm, respectively. Interest income for 2016, 2017, 2018, 2019,
and 2020 was $4mm, $6mm, $21mm, $36mm, and $15mm, respectively. Numbers may not recalculate due to rounding. 3 As of the end of the stated period. 4 Net Asset Value is the sum of cash and cash equivalents, U.S. Treasury
securities, at fair value, GP & Other Investments, and Net performance fees receivable (all on an unconsolidated basis). GP & Other Investments represents Apollo's general partner investments in the funds it manages and other
balance sheet investments. Investment in Athene primarily comprises Apollo's direct investment of 54.6 million shares (subject to a discount due to a lack of marketability) of Athene Holding valued at $35.59 per share as of
December 31, 2020. Net performance fees receivable excludes profit sharing expected to be settled in the form of equity-based awards. 5 Cash and cash equivalents of $1,555mm as of December 31, 2020. 6 In connection with
the June 2020 debt offering, S&P downgraded Apollo from A (negative outlook) to A- (stable outlook).
APOLLO
20View entire presentation