Getty SPAC Presentation Deck
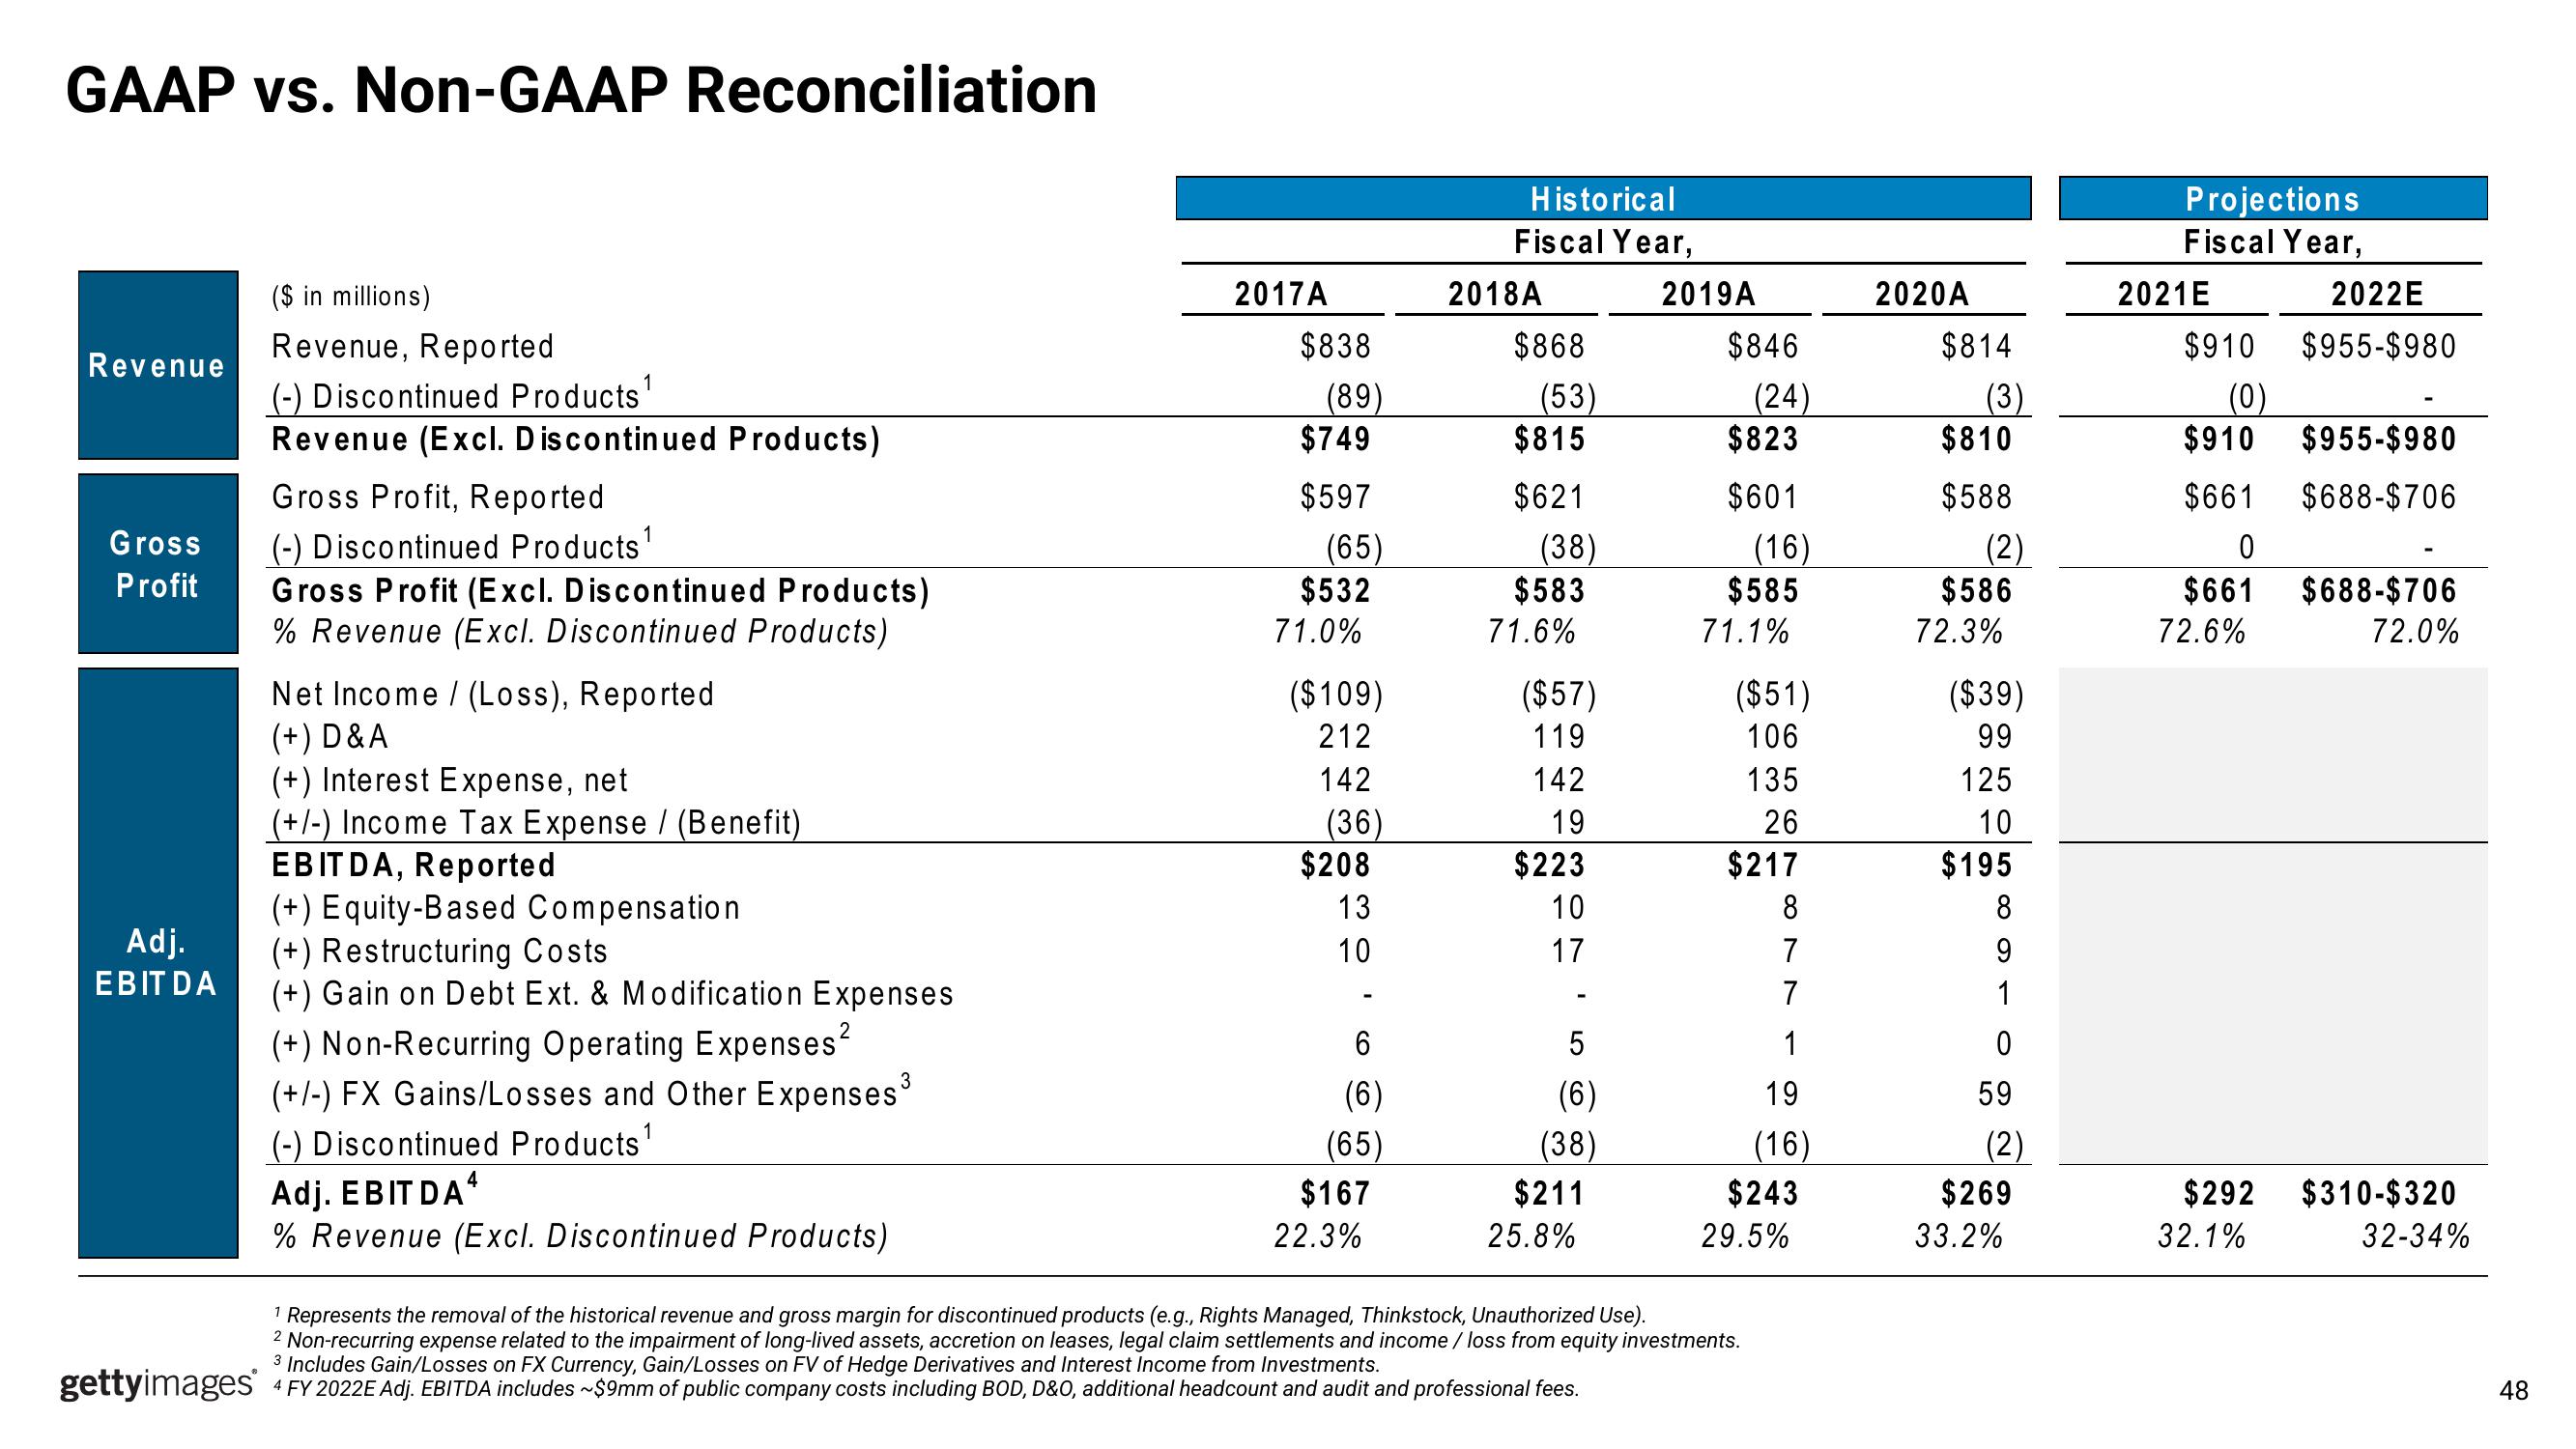
GAAP vs. Non-GAAP Reconciliation
Revenue
Gross
Profit
Adj.
EBITDA
gettyimages
($ in millions)
Revenue, Reported
1
(-) Discontinued Products ¹
Revenue (Excl. Discontinued Products)
Gross Profit, Reported
1
(-) Discontinued Products ¹
Gross Profit (Excl. Discontinued Products)
% Revenue (Excl. Discontinued Products)
Net Income (Loss), Reported
(+) D&A
(+) Interest Expense, net
(+/-) Income Tax Expense / (Benefit)
EBITDA, Reported
(+) Equity-Based Compensation
(+) Restructuring Costs
(+) Gain on Debt Ext. & Modification Expenses
(+) Non-Recurring Operating Expenses²
(+/-) FX Gains/Losses and Other Expenses³
(-) Discontinued Products ¹
1
Adj. EBITDA*
% Revenue (Excl. Discontinued Products)
2017A
$838
(89)
$749
$597
(65)
$532
71.0%
($109)
212
142
(36)
$208
13
10
6
(6)
(65)
$167
22.3%
Historical
Fiscal Year,
2018A
$868
(53)
$815
$621
(38)
$583
71.6%
($57)
119
142
19
$223
10
17
5
(6)
(38)
$211
25.8%
2019A
$846
(24)
$823
$601
(16)
$585
71.1%
($51)
106
135
26
$217
8
7
7
1
19
(16)
$243
1 Represents the removal of the historical revenue and gross margin for discontinued products (e.g., Rights Managed, Thinkstock, Unauthorized Use).
2 Non-recurring expense related to the impairment of long-lived assets, accretion on leases, legal claim settlements and income / loss from equity investments.
3 Includes Gain/Losses on FX Currency, Gain/Losses on FV of Hedge Derivatives and Interest Income from Investments.
4 FY 2022E Adj. EBITDA includes ~$9mm of public company costs including BOD, D&O, additional headcount and audit and professional fees.
29.5%
2020A
$814
(3)
$810
$588
(2)
$586
72.3%
($39)
99
125
10
$195
8
9
1
0
59
(2)
$269
33.2%
Projections
Fiscal Year,
2021E
2022E
$910 $955-$980
(0)
$910 $955-$980
$661
$688-$706
0
$661
72.6%
$688-$706
72.0%
$292 $310-$320
32-34%
32.1%
48View entire presentation