HashiCorp Investor Presentation Deck
Financial Summary
($ Millions, except percentages)¹
FY2020
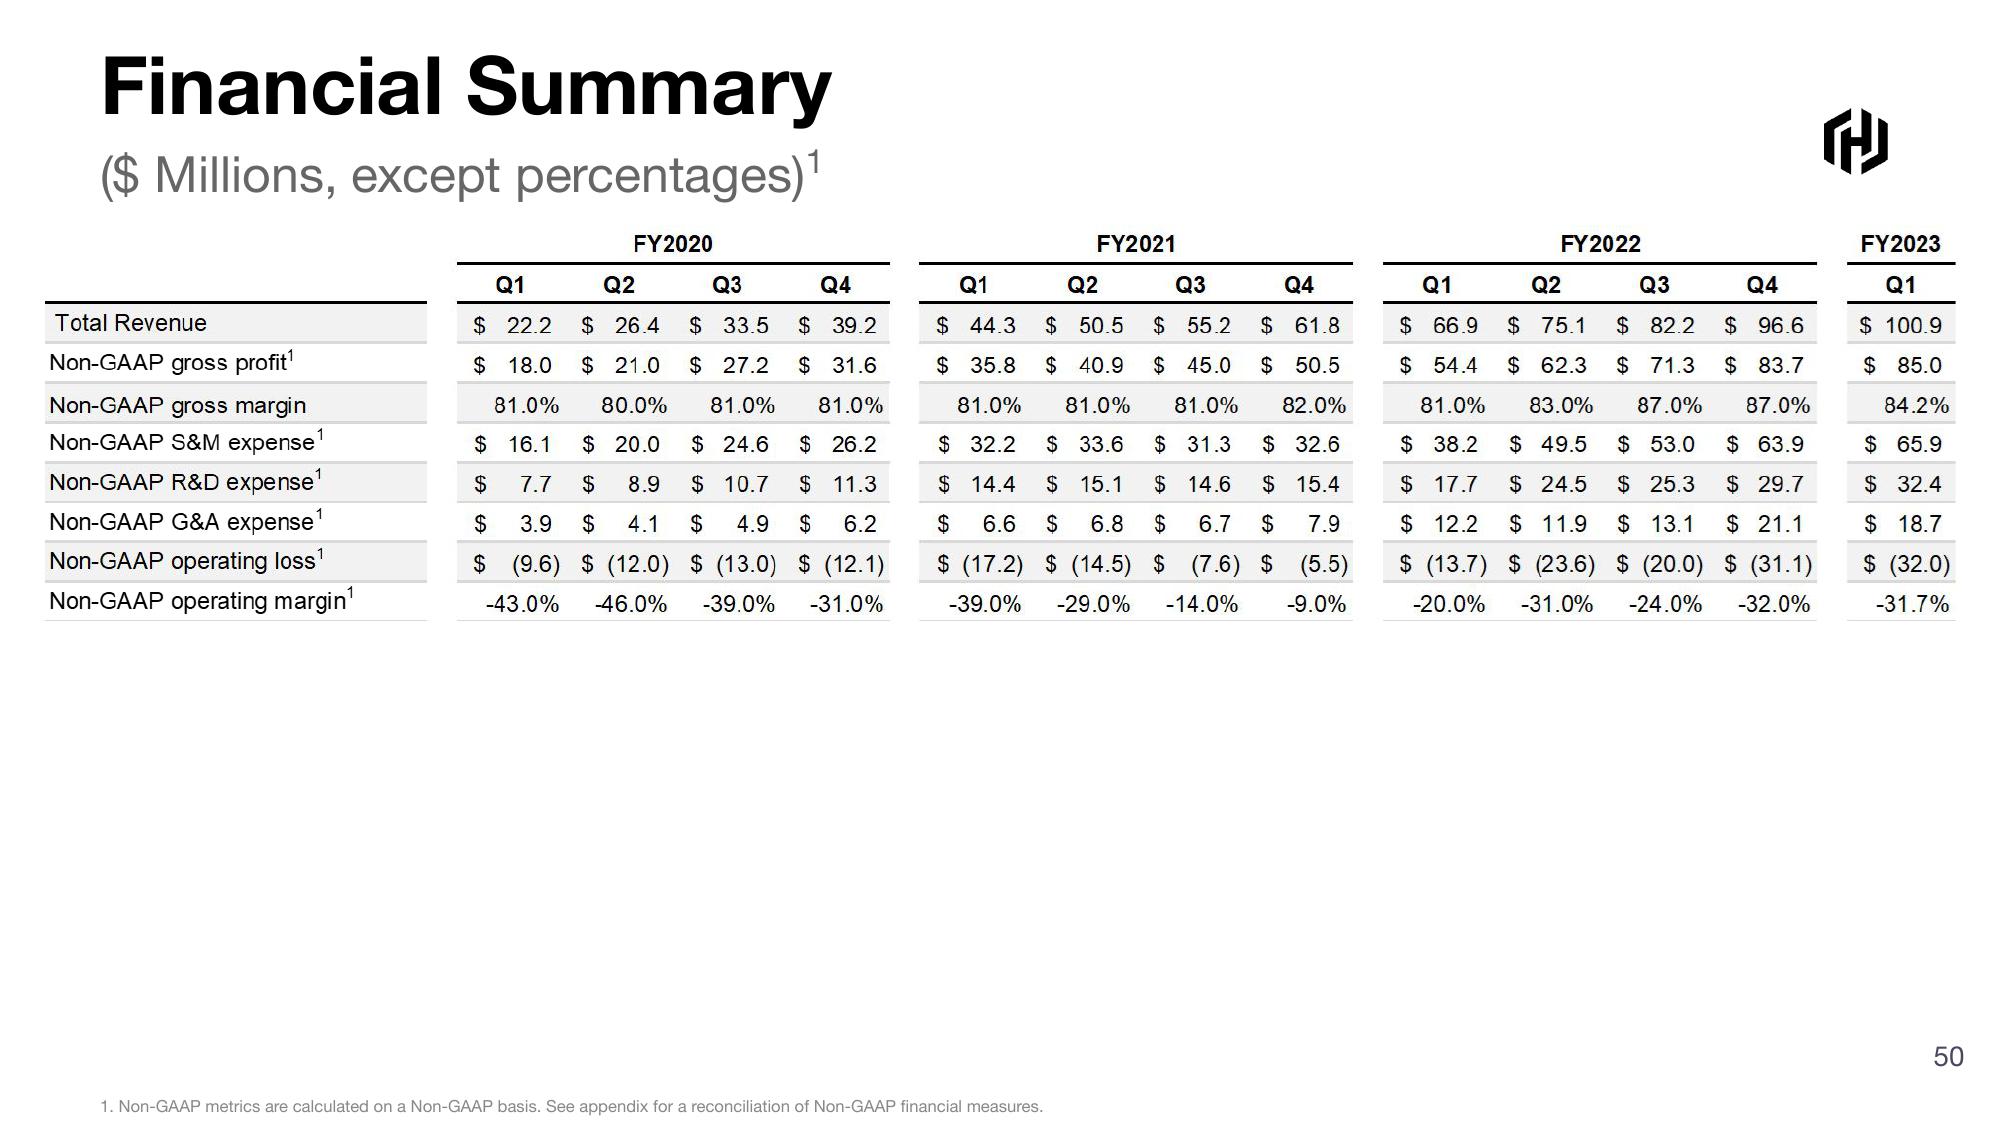
Total Revenue
Non-GAAP gross profit¹
Non-GAAP gross margin
Non-GAAP S&M expense
Non-GAAP R&D expense¹
Non-GAAP G&A expense¹
Non-GAAP operating loss
Non-GAAP operating margin¹
Q1
Q2
Q3
Q4
$22.2 $26.4 $ 33.5 $39.2
$18.0 $ 21.0 $ 27.2 $31.6
81.0% 80.0% 81.0% 81.0%
$16.1 $20.0 $24.6 $26.2
$ 7.7 $ 8.9 $ 10.7 $11.3
$ 3.9 $ 4.1 $ 4.9 $ 6.2
$(9.6) $ (12.0) $ (13.0) $ (12.1)
-43.0% -46.0% -39.0% -31.0%
FY2021
Q1
Q2
Q3
Q4
$ 44.3
$ 55.2
$ 61.8
$ 50.5
$ 35.8 $ 40.9 $ 45.0 $ 50.5
81.0% 81.0% 81.0% 82.0%
$32.2 $ 33.6 $31.3 $32.6
$14.4 $ 15.1 $ 14.6 $15.4
$ 6.6 $ 6.8 $ 6.7 $ 7.9
$ (17.2) $ (14.5) $ (7.6) $ (5.5)
-39.0% -29.0% -14.0% -9.0%
1. Non-GAAP metrics are calculated on a Non-GAAP basis. See appendix for a reconciliation of Non-GAAP financial measures.
FY2022
Q1
Q2
Q3
Q4
$ 66.9
$ 75.1
$ 82.2
$ 54.4
$ 71.3
$ 96.6
$ 62.3
$83.7
81.0% 83.0% 87.0% 87.0%
$38.2 $49.5 $ 53.0 $ 63.9
$ 17.7 $24.5 $ 25.3 $29.7
$ 12.2 $11.9 $ 13.1 $ 21.1
$ (13.7) $ (23.6) $ (20.0) $ (31.1)
-20.0% -31.0% -24.0% -32.0%
Q
FY2023
Q1
$100.9
$85.0
84.2%
$65.9
$32.4
$18.7
$ (32.0)
-31.7%
50View entire presentation